Has been a while since I got to use Grafana, and since I decided to reinstall OEM, I have decided to try to monitor the Oracle Databases using Grafana
Just to clarify, this is just a test to get to understand Grafana and other components like Prometheus, not something that could be consider in your production system.
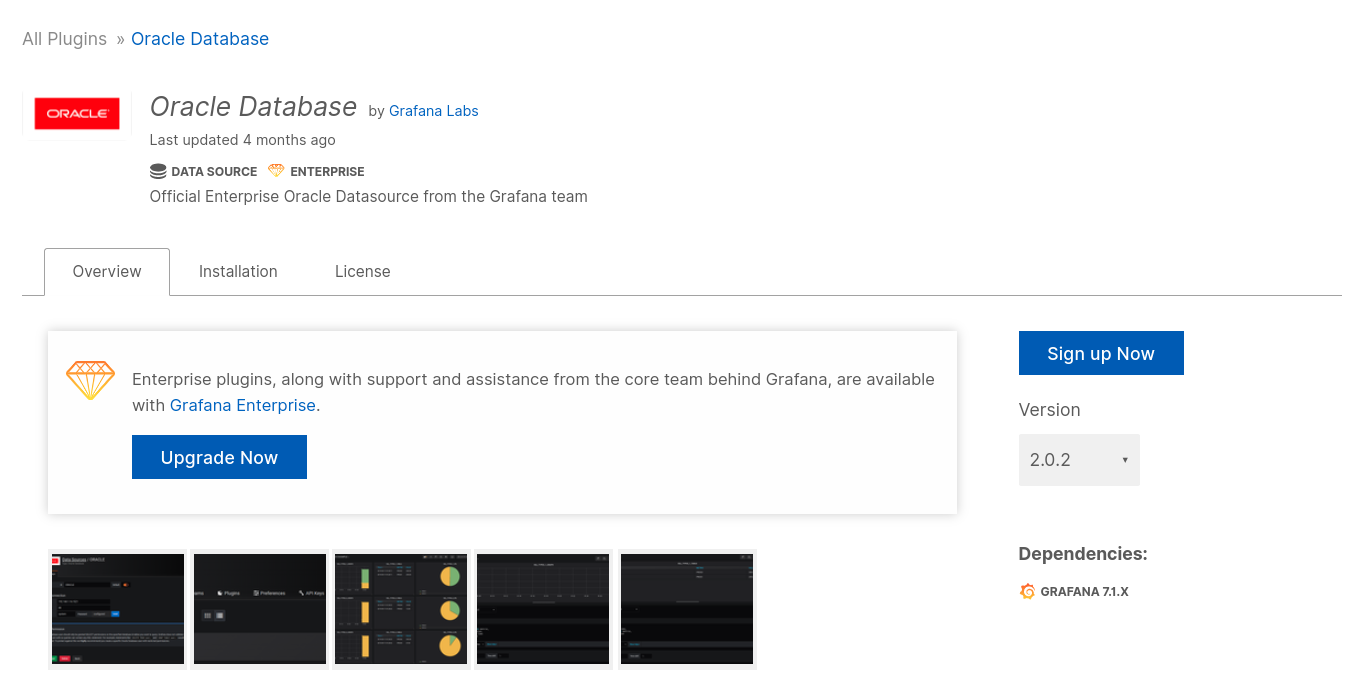
Actually, Grafana has a native plugin to monitor Oracle systems, but is not a free one:
Oracle Database by Grafana Labs
Still, there is Oracle Documention mentioning oracledb_exporter as an option that shows a good schema of the configuration
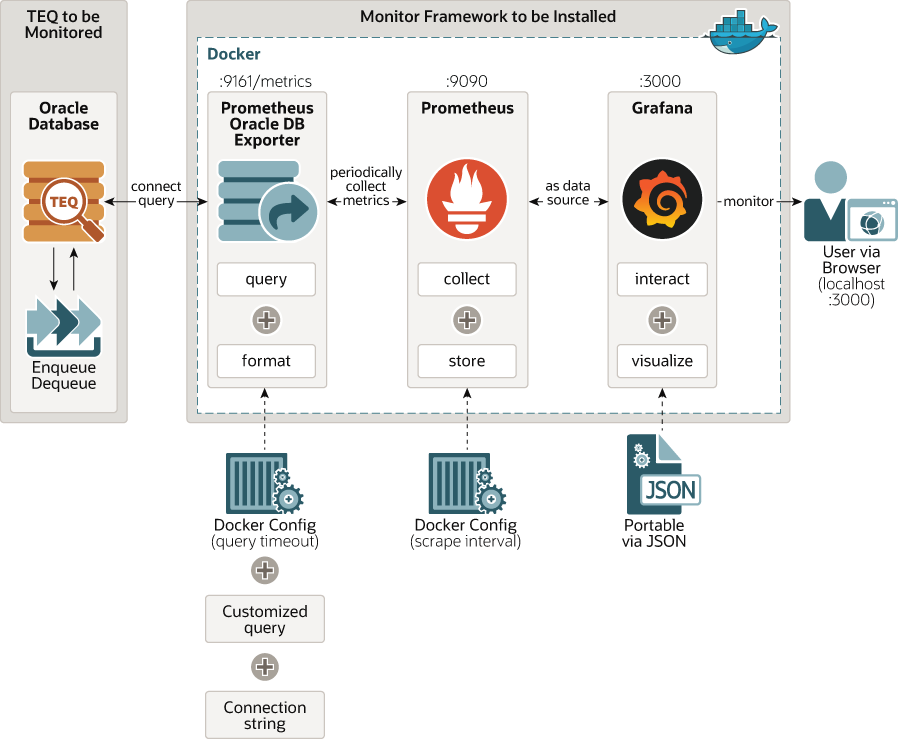
Like it is mentioned in oracledb_exporter github, oracledb_exporter is a prometheus exporter.
The current Grafana configuration I’m using for this post has also more elements for other systems monitoring since I forked stefanprodan/dockprom github
More info on that gihub and this Article about setting Grafana with Prometheus: DOCKER – PROMETHEUS AND GRAFANA WITH DOCKER-COMPOSE
I hope to get to use Grafana more and update the fork I created, but at least for now, will help me to explain how I got Grafana monitoring working for Oracle Database
Actions List
- Preparing the System
- Environment configuration
- Starting the system
- Adding a Grafana Panel
- Custom oracledbexporter Metrics
- Troubleshooting
Preparing the System
I’m doing this in the oem13 server I used for the OEM 13.4 Installation which is Oracle Linux 7, so I needed to add the extra ol7_addons repository to get docker installed more easily.
Let’s start installing docker and docker-compose
|=| oem13 in ~ ○ → yum install -y oracle-softwarecollection-release-el7 yum-utils
[....]

Complete!
|=| oem13 in ~ ○ →

|=| oem13 in ~ ○ → yum-config-manager --enable ol7_addons
================================== repo: ol7_addons ===================================
[ol7_addons]
async = True
bandwidth = 0
base_persistdir = /var/lib/yum/repos/x86_64/7Server
baseurl = https://yum.oracle.com/repo/OracleLinux/OL7/addons/x86_64/
cache = 0
cachedir = /var/cache/yum/x86_64/7Server/ol7_addons
check_config_file_age = True
[....]
|=| oem13 in ~ ○ →

|=| oem13 in ~ ○ → yum install docker -y
Loaded plugins: ulninfo
ol7_UEKR5                                                       | 2.5 kB  00:00:00
ol7_addons                                                      | 2.5 kB  00:00:00
ol7_latest                                                      | 2.7 kB  00:00:00
(1/2): ol7_addons/x86_64/primary_db                             | 169 kB  00:00:00
[....]

Complete!
|=| oem13 in ~ ○ →

|=| oem13 in ~ ○ → sudo curl -L "https://github.com/docker/compose/releases/download/1.28.2/docker-compose-$(uname -s)-$(uname -m)" -o /usr/local/bin/docker-compose
  % Total    % Received % Xferd  Average Speed   Time    Time     Time  Current
                                 Dload  Upload   Total   Spent    Left  Speed
100   633  100   633    0     0   1013      0 --:--:-- --:--:-- --:--:--  1012
100 11.6M  100 11.6M    0     0  4661k      0  0:00:02  0:00:02 --:--:-- 7101k
|=| oem13 in ~ ○ → sudo chmod +x /usr/local/bin/docker-compose
|=| oem13 in ~ ○ →
|=| oem13 in ~ ○ → systemctl enable --now docker
Created symlink from /etc/systemd/system/multi-user.target.wants/docker.service to /usr/lib/systemd/system/docker.service.
|=| oem13 in ~ ○ →
Let’s clone the github repository I created for this
|=| oem13 in ~ ○ → git clone https://github.com/Project-42/grafana_oracle.git
Cloning into 'grafana_oracle'...
remote: Enumerating objects: 70, done.
remote: Counting objects: 100% (70/70), done.
remote: Compressing objects: 100% (42/42), done.
remote: Total 958 (delta 34), reused 57 (delta 23), pack-reused 888
Receiving objects: 100% (958/958), 2.35 MiB | 3.12 MiB/s, done.
Resolving deltas: 100% (559/559), done.

|=| oem13 in ~ ○ →
As result, you will have the following docker-compose playbook as well as all the needed files to deploy Grafana and the rest of components
version: '3.4'
networks:
  monitor-net:
    driver: bridge

volumes:
    prometheus_data: {}
    #  external: true
    grafana_data: {}
    #  external: true

services:

  prometheus:
    image: prom/prometheus:v2.24.0
    container_name: prometheus
    volumes:
      - ./prometheus:/etc/prometheus
      - prometheus_data:/prometheus
    command:
      - '--config.file=/etc/prometheus/prometheus.yml'
      - '--storage.tsdb.path=/prometheus'
      - '--web.console.libraries=/etc/prometheus/console_libraries'
      - '--web.console.templates=/etc/prometheus/consoles'
      - '--storage.tsdb.retention.time=200h'
      - '--web.enable-lifecycle'
    restart: unless-stopped
    expose:
      - 9090
    networks:
      - monitor-net
    labels:
      org.label-schema.group: "monitoring"

  oracledbexporter:
    image: iamseth/oracledb_exporter
    container_name: oracledbexporter
    volumes:
      - ./oracledbexporter:/etc/oracledb_exporter
    environment:
      - 'NLS_LANG=AMERICAN_AMERICA.WE8ISO8859P1'
      - 'DATA_SOURCE_NAME=${DB_CONNECTION_STRING}'
#      - 'DATA_SOURCE_NAME=${DB_CONNECTION_STRING:-dbsnmp/Welcome1@//rac1-scan:1521/db122}'
#      - 'DATA_SOURCE_NAME=dbsnmp/Welcome1@//rac2-scan:1521/st19'
      - 'CUSTOM_METRICS=/etc/oracledb_exporter/custom-metrics.toml'
    restart: unless-stopped
    expose:
      - 9161
    network_mode: host
    labels:
      org.label-schema.group: "monitoring"

  alertmanager:
    image: prom/alertmanager:v0.21.0
    container_name: alertmanager
    volumes:
      - ./alertmanager:/etc/alertmanager
    command:
      - '--config.file=/etc/alertmanager/config.yml'
      - '--storage.path=/alertmanager'
    restart: unless-stopped
    expose:
      - 9093
    networks:
      - monitor-net
    labels:
      org.label-schema.group: "monitoring"

  nodeexporter:
    image: prom/node-exporter:v1.0.1
    container_name: nodeexporter
    volumes:
      - /proc:/host/proc:ro
      - /sys:/host/sys:ro
      - /:/rootfs:ro
    command:
      - '--path.procfs=/host/proc'
      - '--path.rootfs=/rootfs'
      - '--path.sysfs=/host/sys'
      - '--collector.filesystem.ignored-mount-points=^/(sys|proc|dev|host|etc)($$|/)'
    restart: unless-stopped
    expose:
      - 9100
    networks:
      - monitor-net
    labels:
      org.label-schema.group: "monitoring"

  cadvisor:
    image: gcr.io/cadvisor/cadvisor:v0.38.7
    container_name: cadvisor
    volumes:
      - /:/rootfs:ro
      - /var/run:/var/run:rw
      - /sys:/sys:ro
      - /var/lib/docker:/var/lib/docker:ro
      #- /cgroup:/cgroup:ro #doesn't work on MacOS only for Linux
    restart: unless-stopped
    expose:
      - 8080
    networks:
      - monitor-net
    labels:
      org.label-schema.group: "monitoring"

  grafana:
    image: grafana/grafana:7.3.7
    container_name: grafana
    volumes:
      - grafana_data:/var/lib/grafana
      - ./grafana/provisioning:/etc/grafana/provisioning
    environment:
      - GF_SECURITY_ADMIN_USER=${GF_ADMIN_USER}
      - GF_SECURITY_ADMIN_PASSWORD=${GF_ADMIN_PASSWORD}
      - GF_USERS_ALLOW_SIGN_UP=false
      - GF_INSTALL_PLUGINS=grafana-piechart-panel,michaeldmoore-annunciator-panel
    restart: unless-stopped
    expose:
      - 3000
    networks:
      - monitor-net
    labels:
      org.label-schema.group: "monitoring"

  pushgateway:
    image: prom/pushgateway:v1.3.1
    container_name: pushgateway
    restart: unless-stopped
    expose:
      - 9091
    networks:
      - monitor-net
    labels:
      org.label-schema.group: "monitoring"

  caddy:
    image: stefanprodan/caddy
    container_name: caddy
    ports:
      - "3000:3000"
      - "9090:9090"
      - "9093:9093"
      - "9091:9091"
    volumes:
      - ./caddy:/etc/caddy
    environment:
      - ADMIN_USER=${CA_ADMIN_USER}
      - ADMIN_PASSWORD=${CA_ADMIN_PASSWORD}
    restart: unless-stopped
    networks:
      - monitor-net
    labels:
      org.label-schema.group: "monitoring"
Environment configuration
Now that we have the repository cloned, the environment and configuration files need to be changed
Inside the file ".env" you can find the default Grafana/caddy passwords as well as the oracledb_exporter DB connection string
|=| oem13 in ~/grafana_oracle ± |master ✓| → cat .env
GF_ADMIN_USER=admin
GF_ADMIN_PASSWORD=Welcome1
CA_ADMIN_USER=admin
CA_ADMIN_PASSWORD=Welcome1
GF_USERS_ALLOW_SIGN_UP=false
DB_CONNECTION_STRING="dbsnmp/Welcome1@//rac1-scan:1521/db122"

|=| oem13 in ~/grafana_oracle ± |master ✓| →
Also, very important part is to change the oracledbexporter IP in the Prometheus configuration file.
For some reason, I needed to hard-code the IP of the server, but ‘localhost’ should actually work, I think my problem is related to my oem13 system using more than 1 network, but I’m not 100% sure, to be honest, need more testing on this
|=| oem13 in ~/grafana_oracle ± |master ✓| → cat prometheus/prometheus.yml

[....]
  - job_name: 'oracledbexporter'
    scrape_interval: 5s
    static_configs:
      - targets: ['192.168.1.60:9161']   <<<<<<<<<<<<<<<<<<
#      - targets: ['localhost:9161']
Starting the system
Once everything is ready, you can use docker-compose command to start it:
|=| oem13 in ~/grafana_oracle ± |master ✓| → docker-compose up -d
Building with native build. Learn about native build in Compose here: https://docs.docker.com/go/compose-native-build/
Creating network "grafana_oracle_monitor-net" with driver "bridge"
Pulling prometheus (prom/prometheus:v2.24.0)...
Trying to pull repository docker.io/prom/prometheus ...
v2.24.0: Pulling from docker.io/prom/prometheus
ea97eb0eb3ec: Pull complete
ec0e9aba71a6: Pull complete
2c56484238c4: Pull complete
[....]
4c1f60f6eae1: Pull complete
8ecb576689d7: Pull complete
5669d55a34cf: Pull complete
Digest: sha256:44541cfacb66f4799f81f17fcfb3cb757ccc8f327592745549f5930c42d115c9
Status: Downloaded newer image for stefanprodan/caddy:latest
Creating cadvisor         ... done
Creating alertmanager     ... done
Creating prometheus       ... done
Creating oracledbexporter ... done
Creating grafana          ... done
Creating pushgateway      ... done
Creating nodeexporter     ... done
Creating caddy            ... done

|=| oem13 in ~/grafana_oracle ± |master ✓| →
Once all is running, you should be able to login into your grafana (using port 3000) and prometheus or oracledb_exporter using your browser:
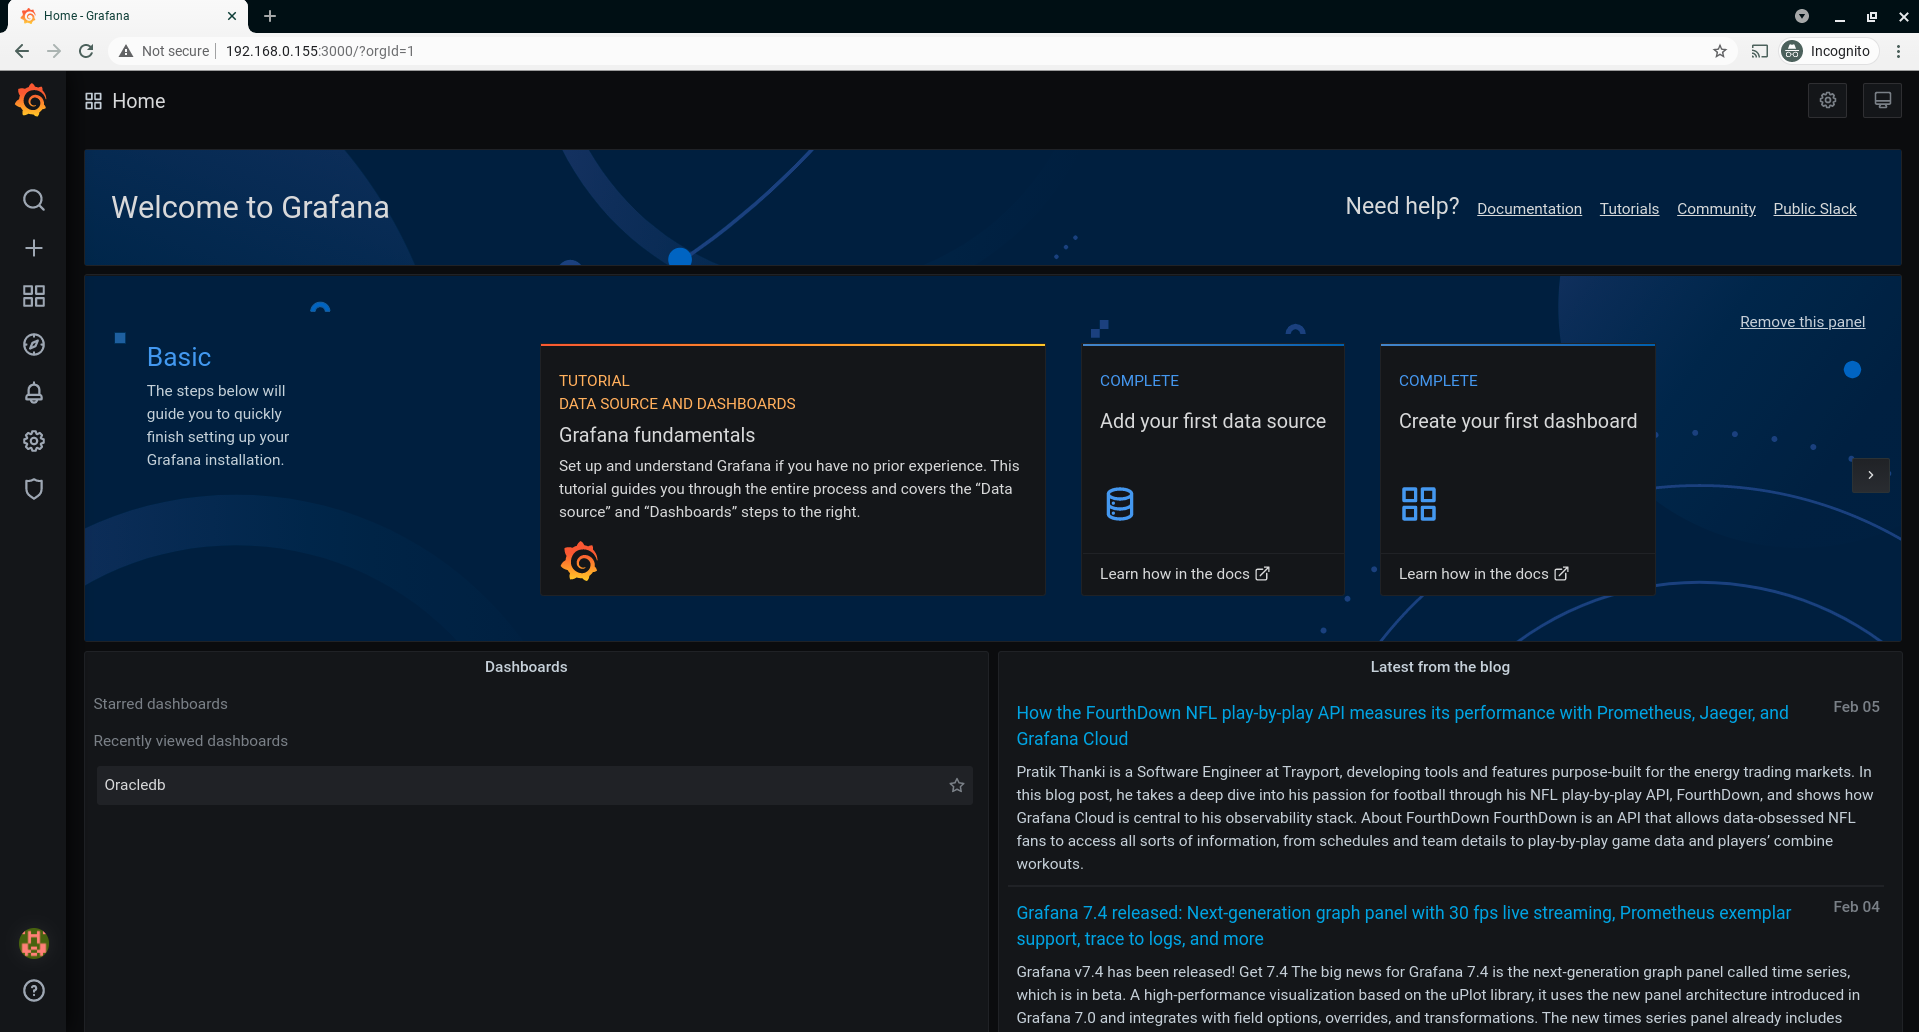
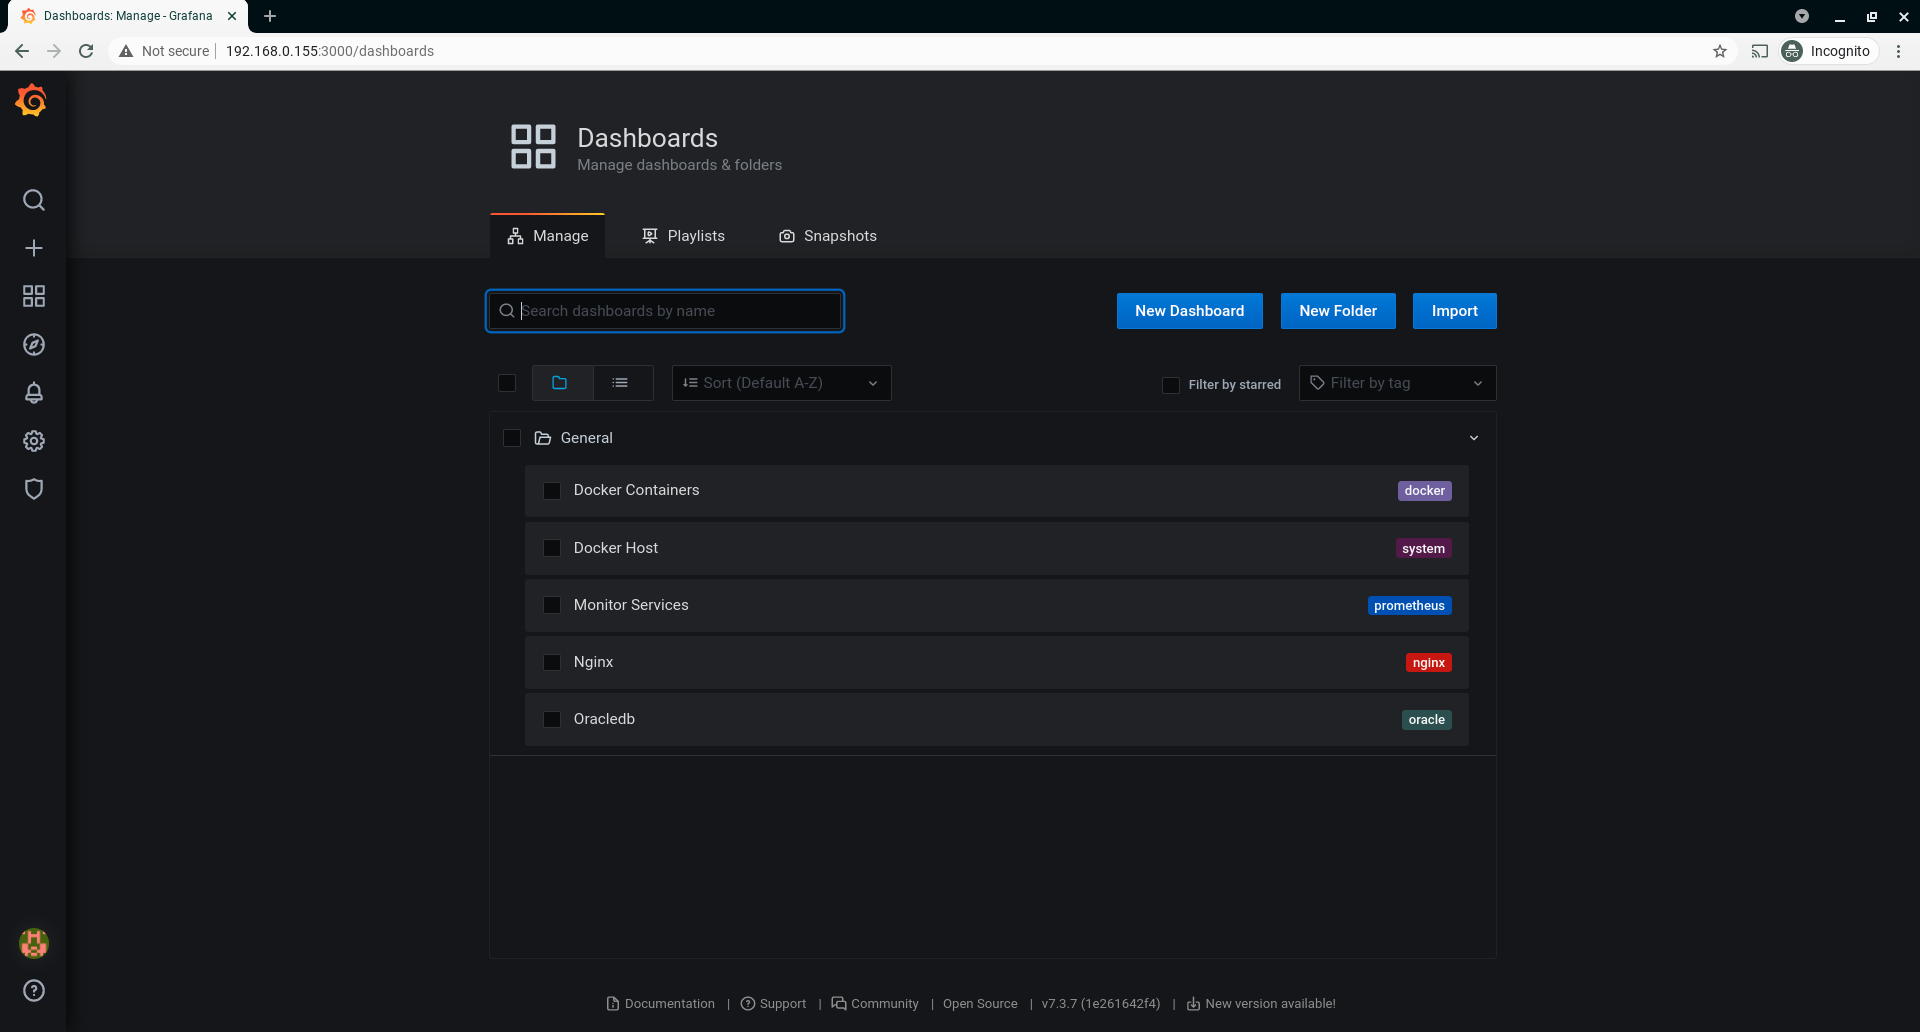
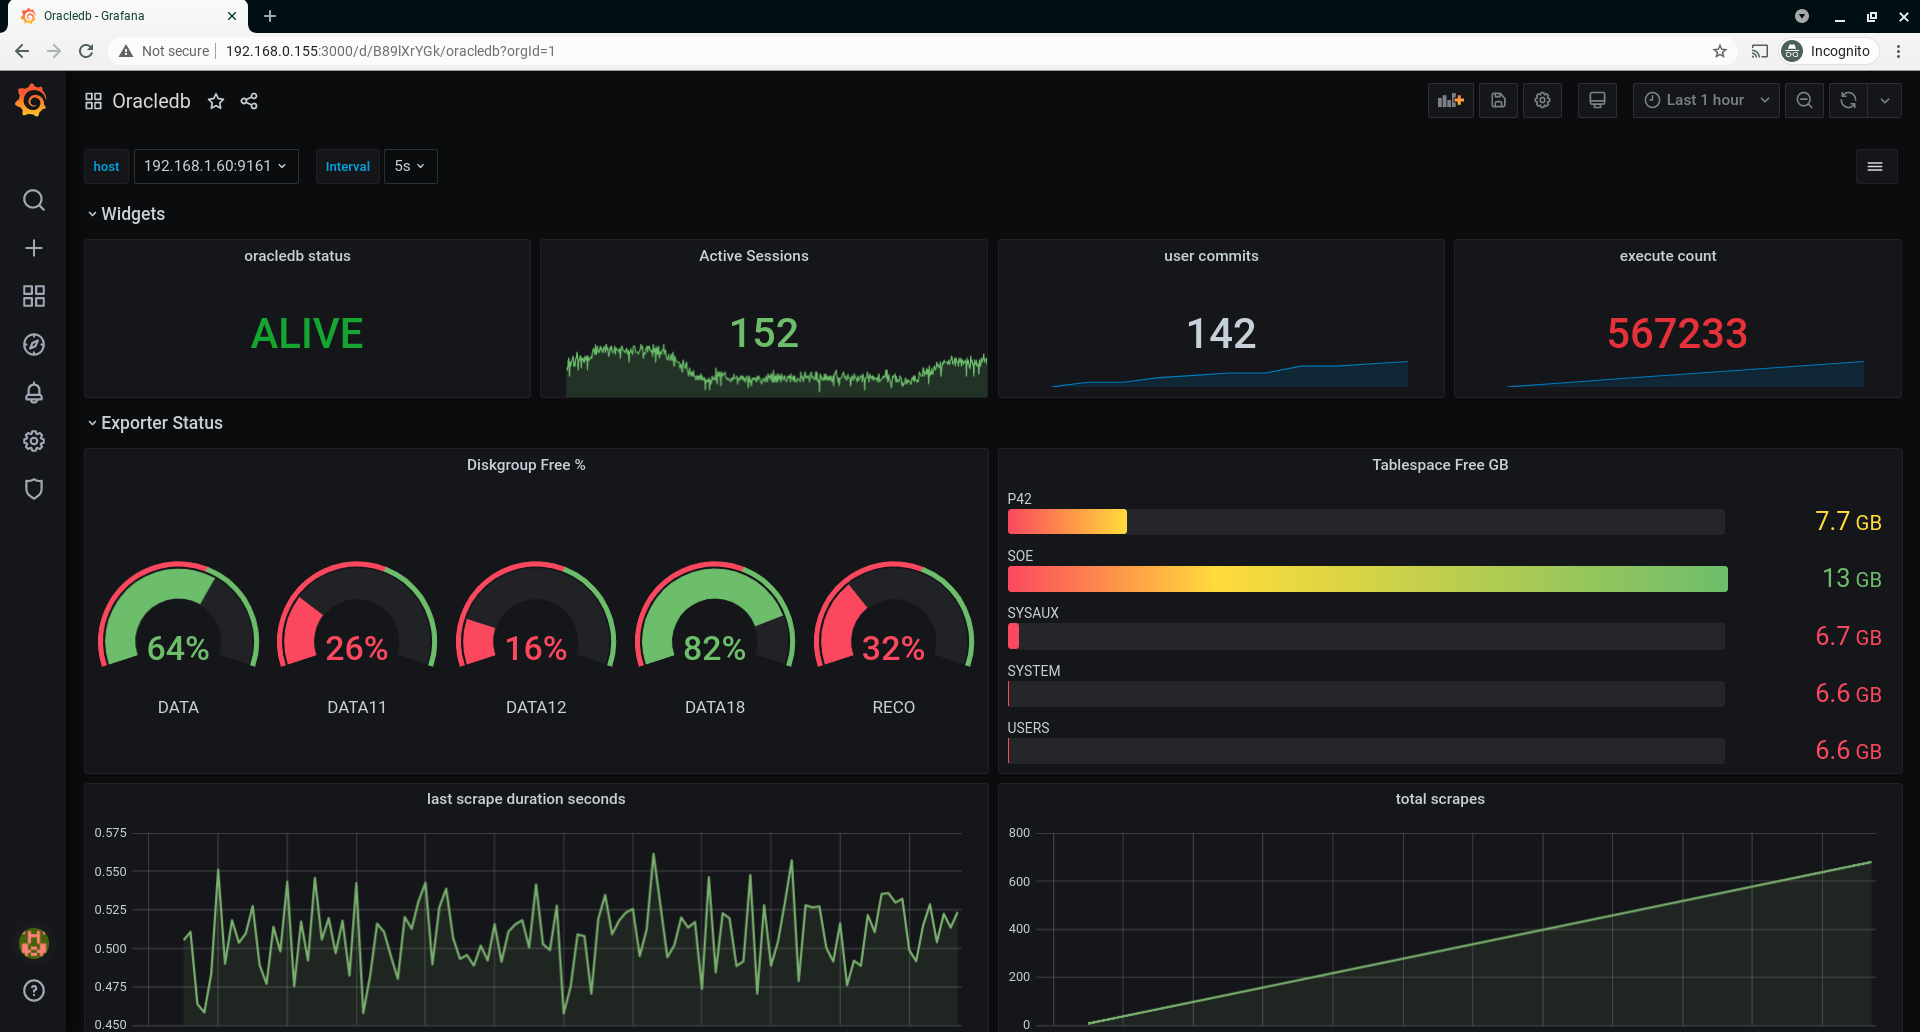
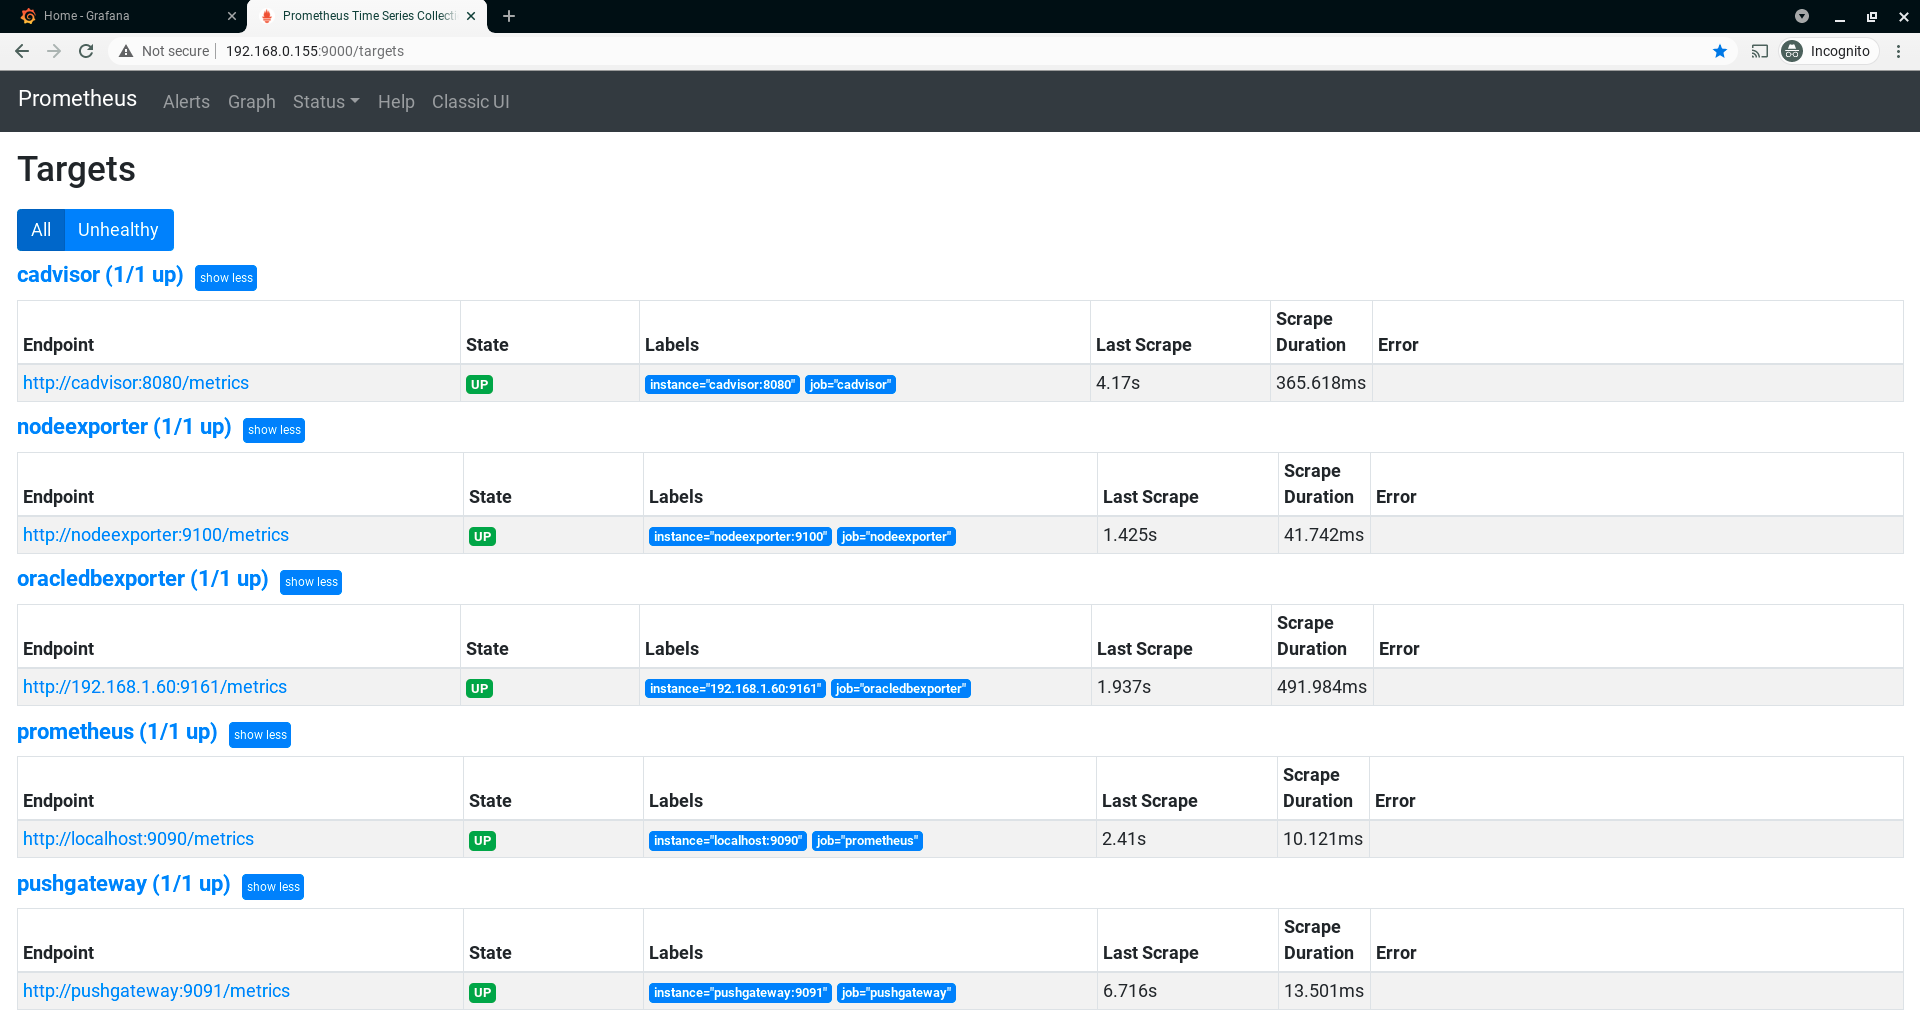
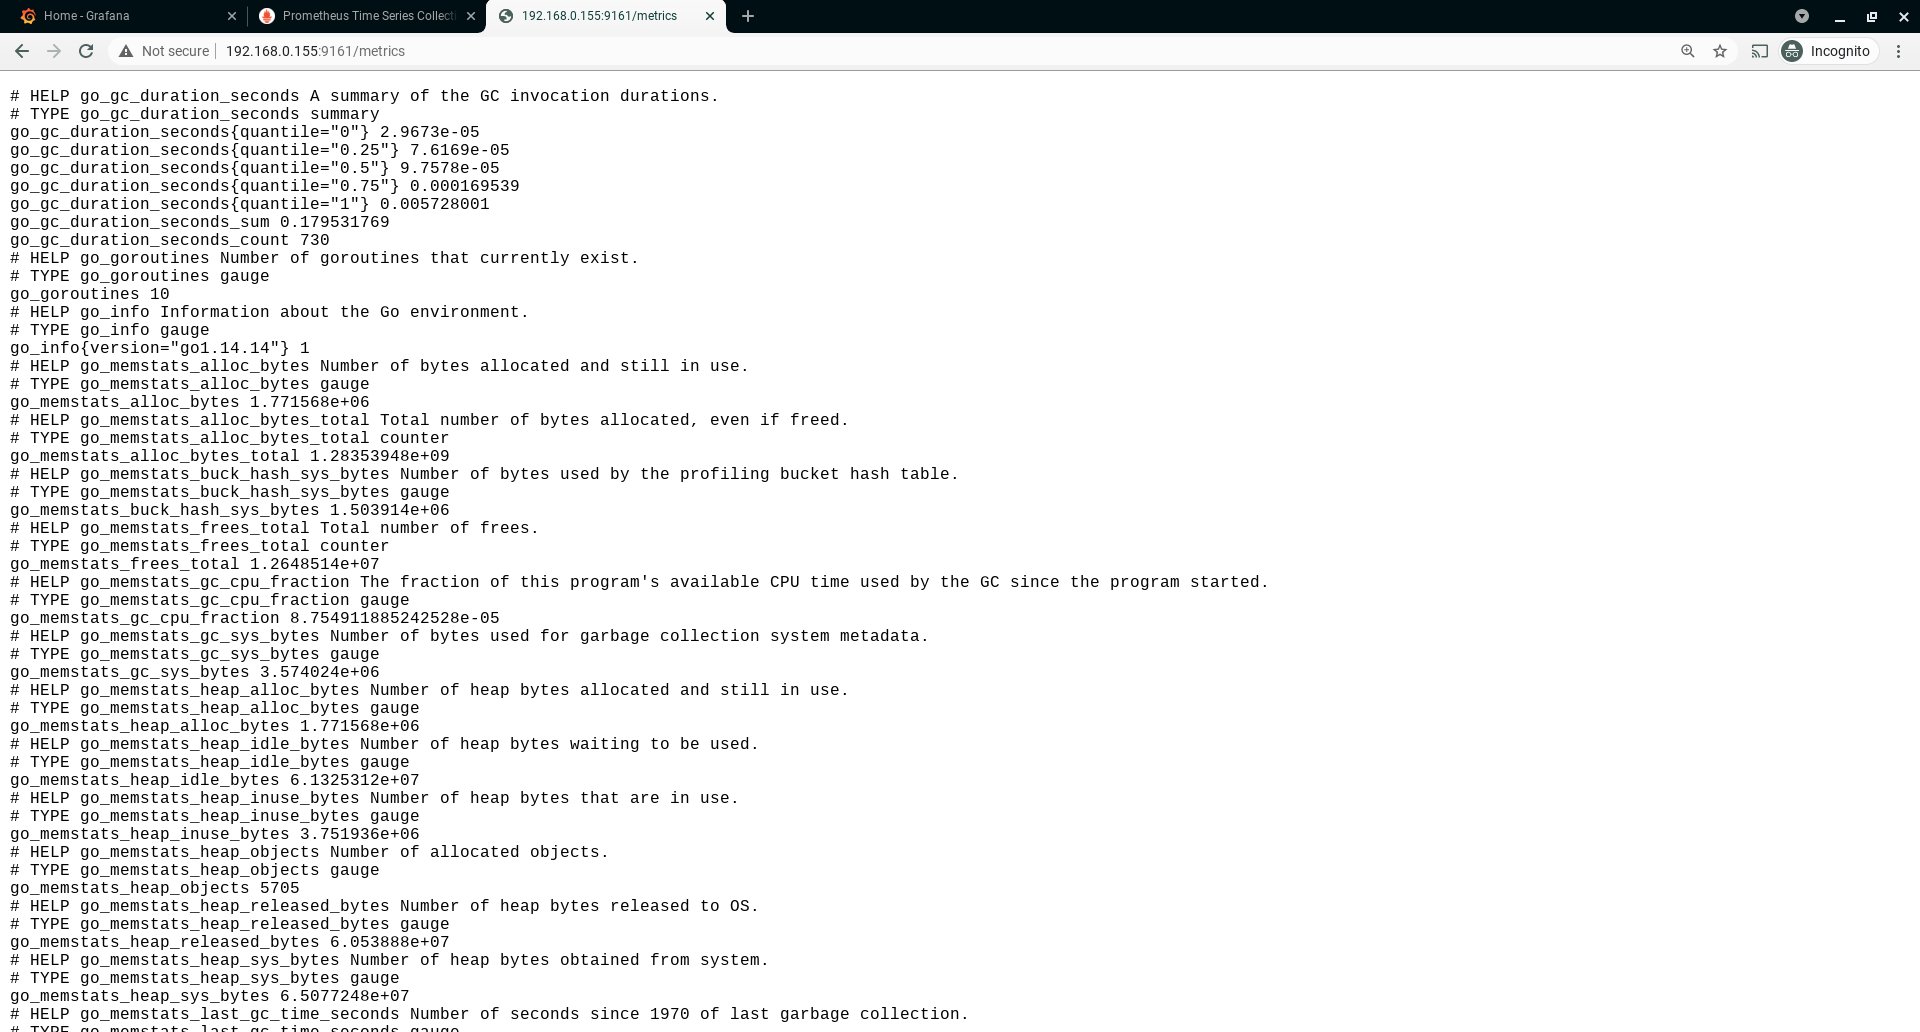
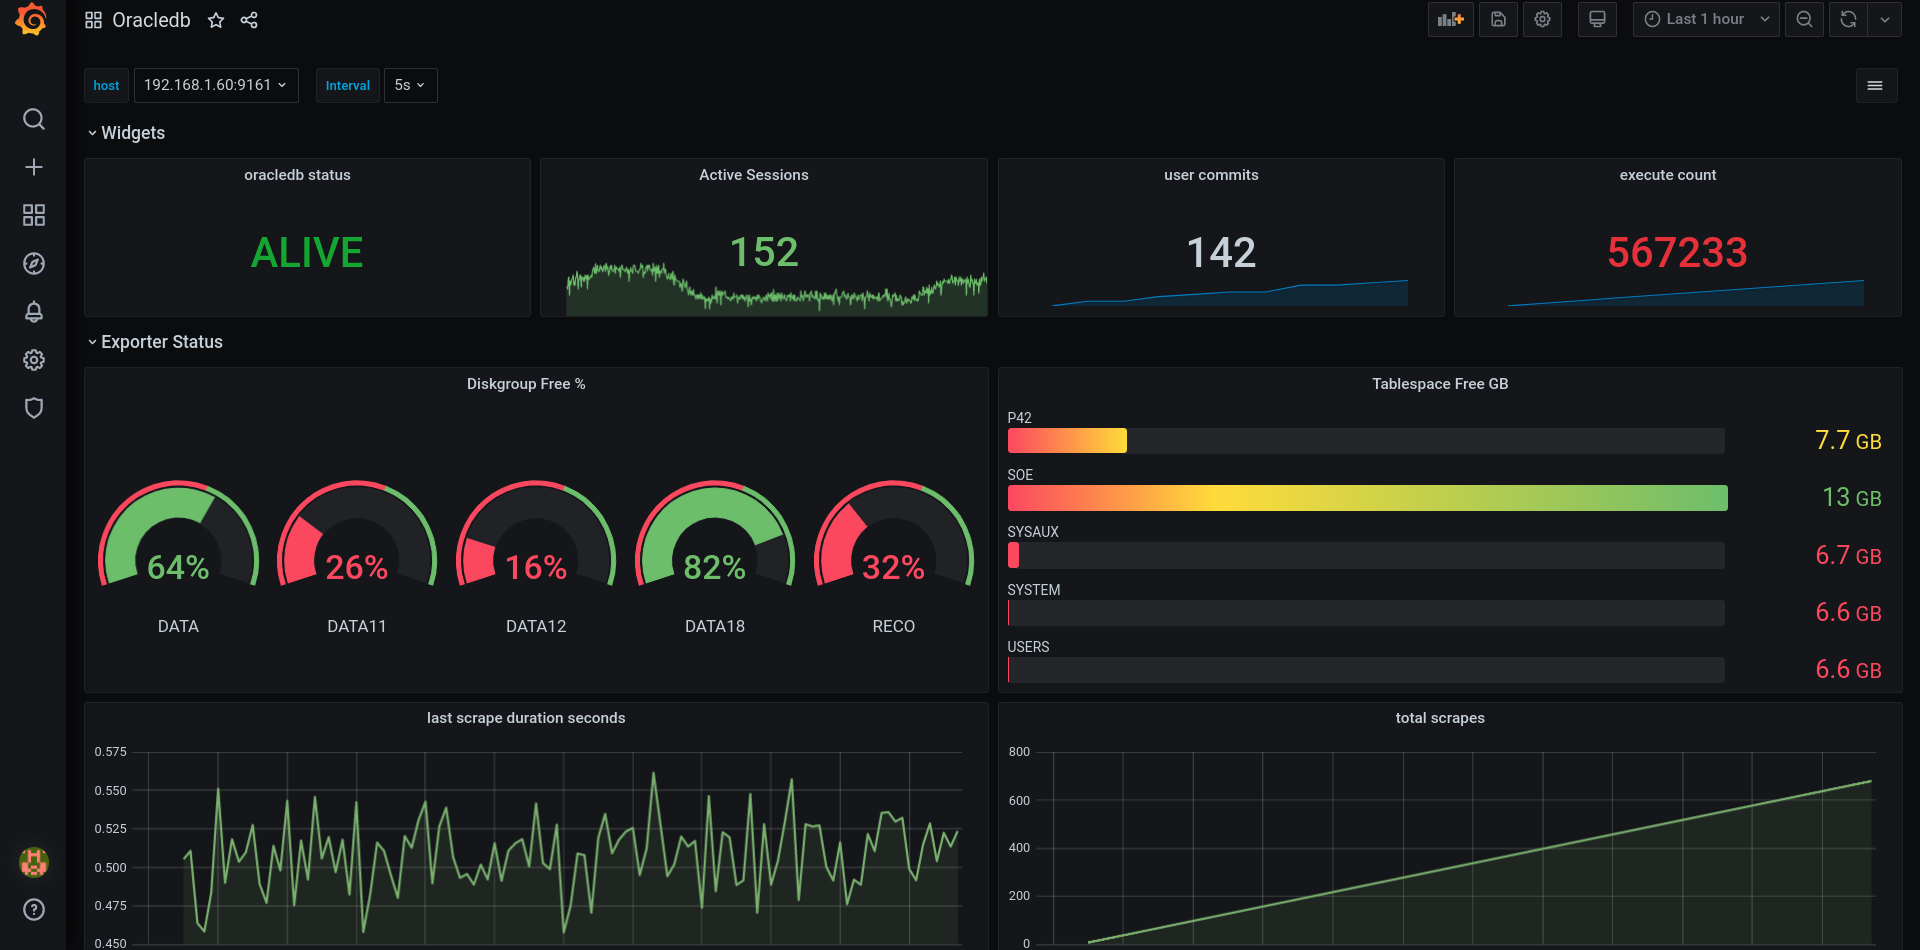
I found couple of Grafana Dashboards to use, but decided to only keep Oracledb by Kallen Ding since was the easier for me to make it work
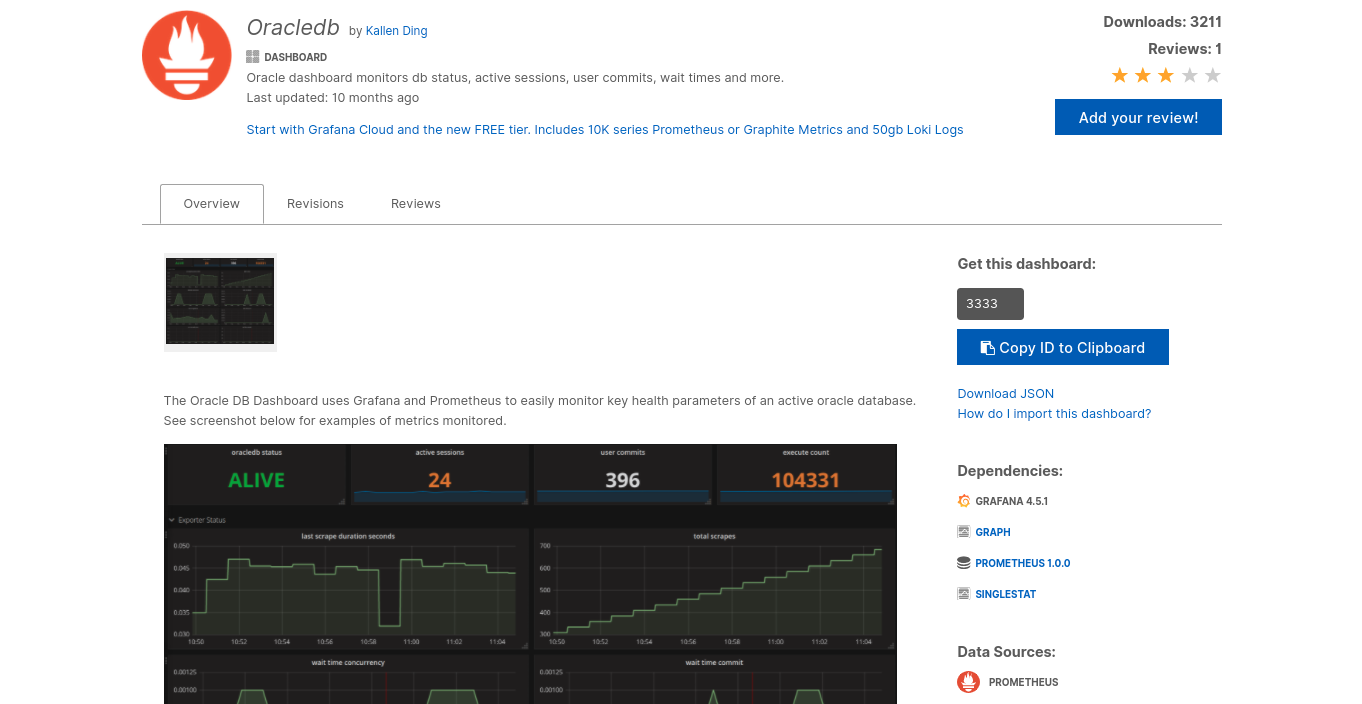
But please check some other out, is always worth to check for ideas and extra metrics:
Oracle by marvinn
Promcat Oracle Grafana dashboard
Adding a Grafana Panel
You can add different panels for the different metrics you have.
Check the metric you want to add from oracledb_exporter (easiest way is to connect with your browser)
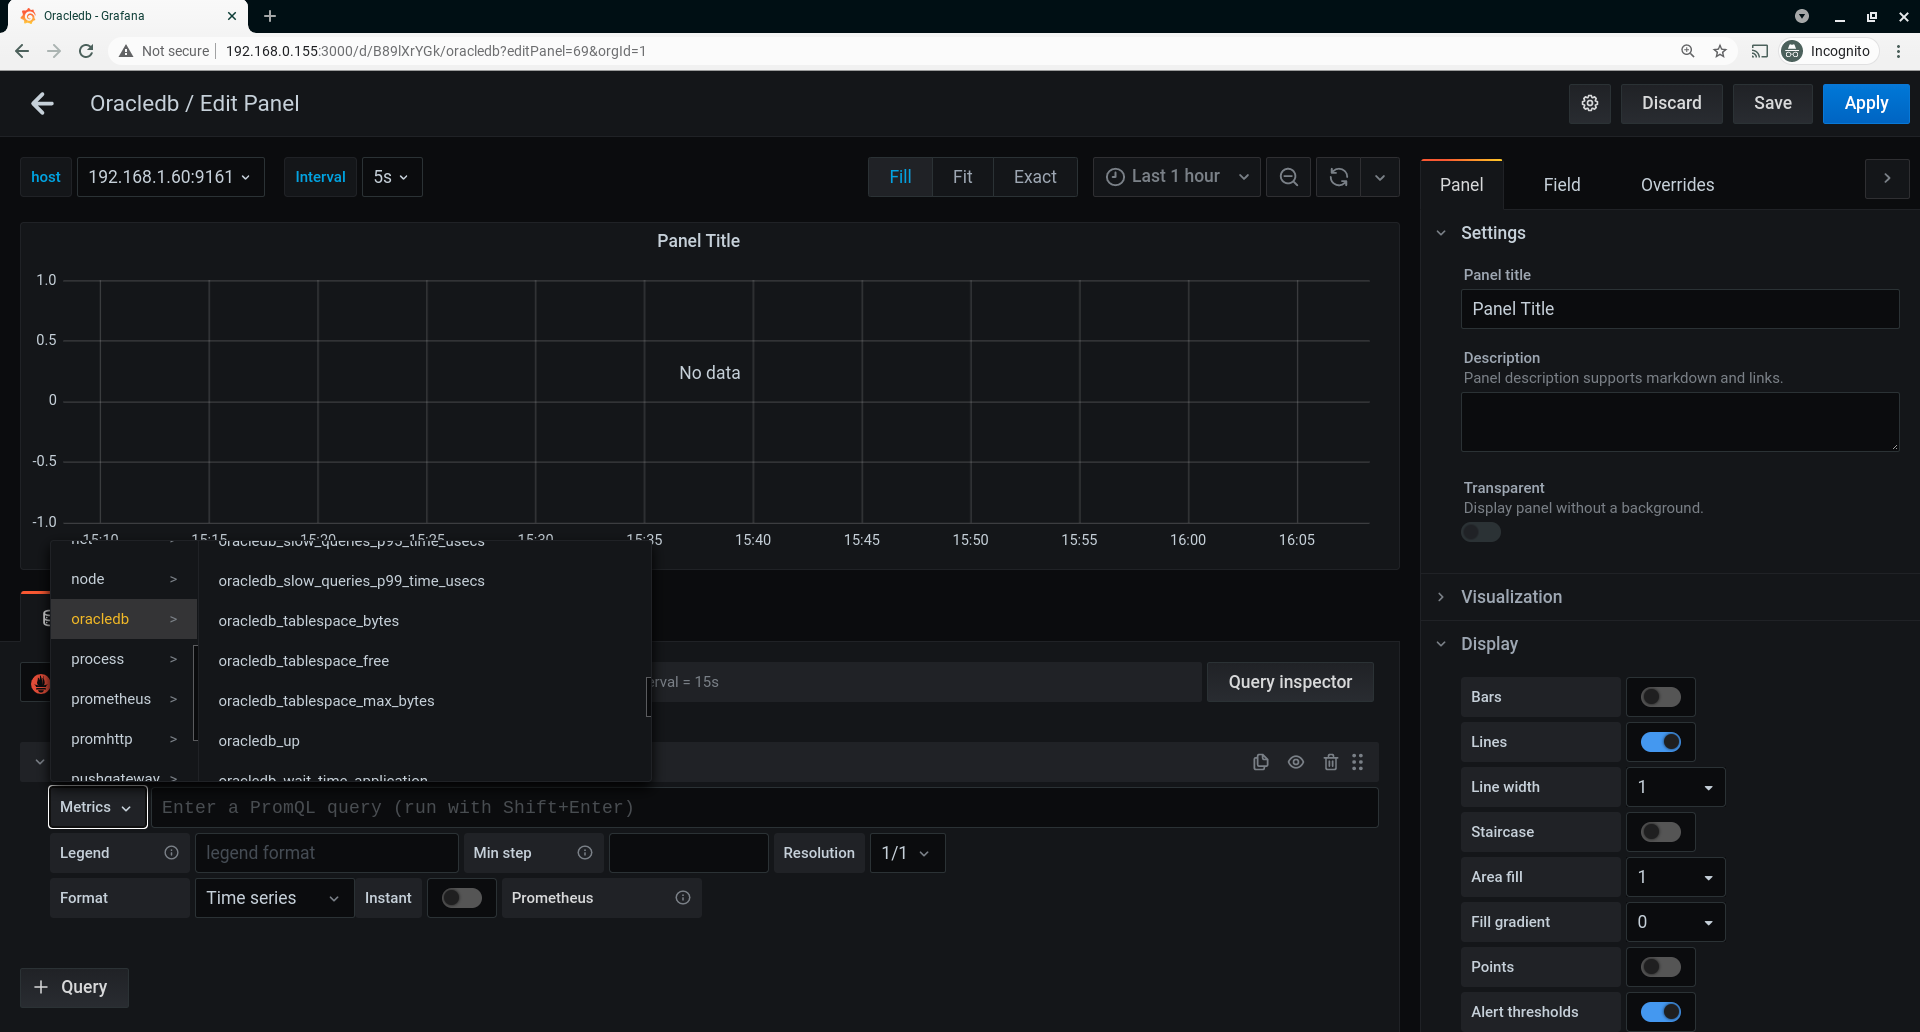
I will use "oracledb_tablespace_bytes" for this example.
Once you click in add new Panel in your dashboard, go to Metrics, select oracledbexporter and the metric oracledb_tablespace_bytes
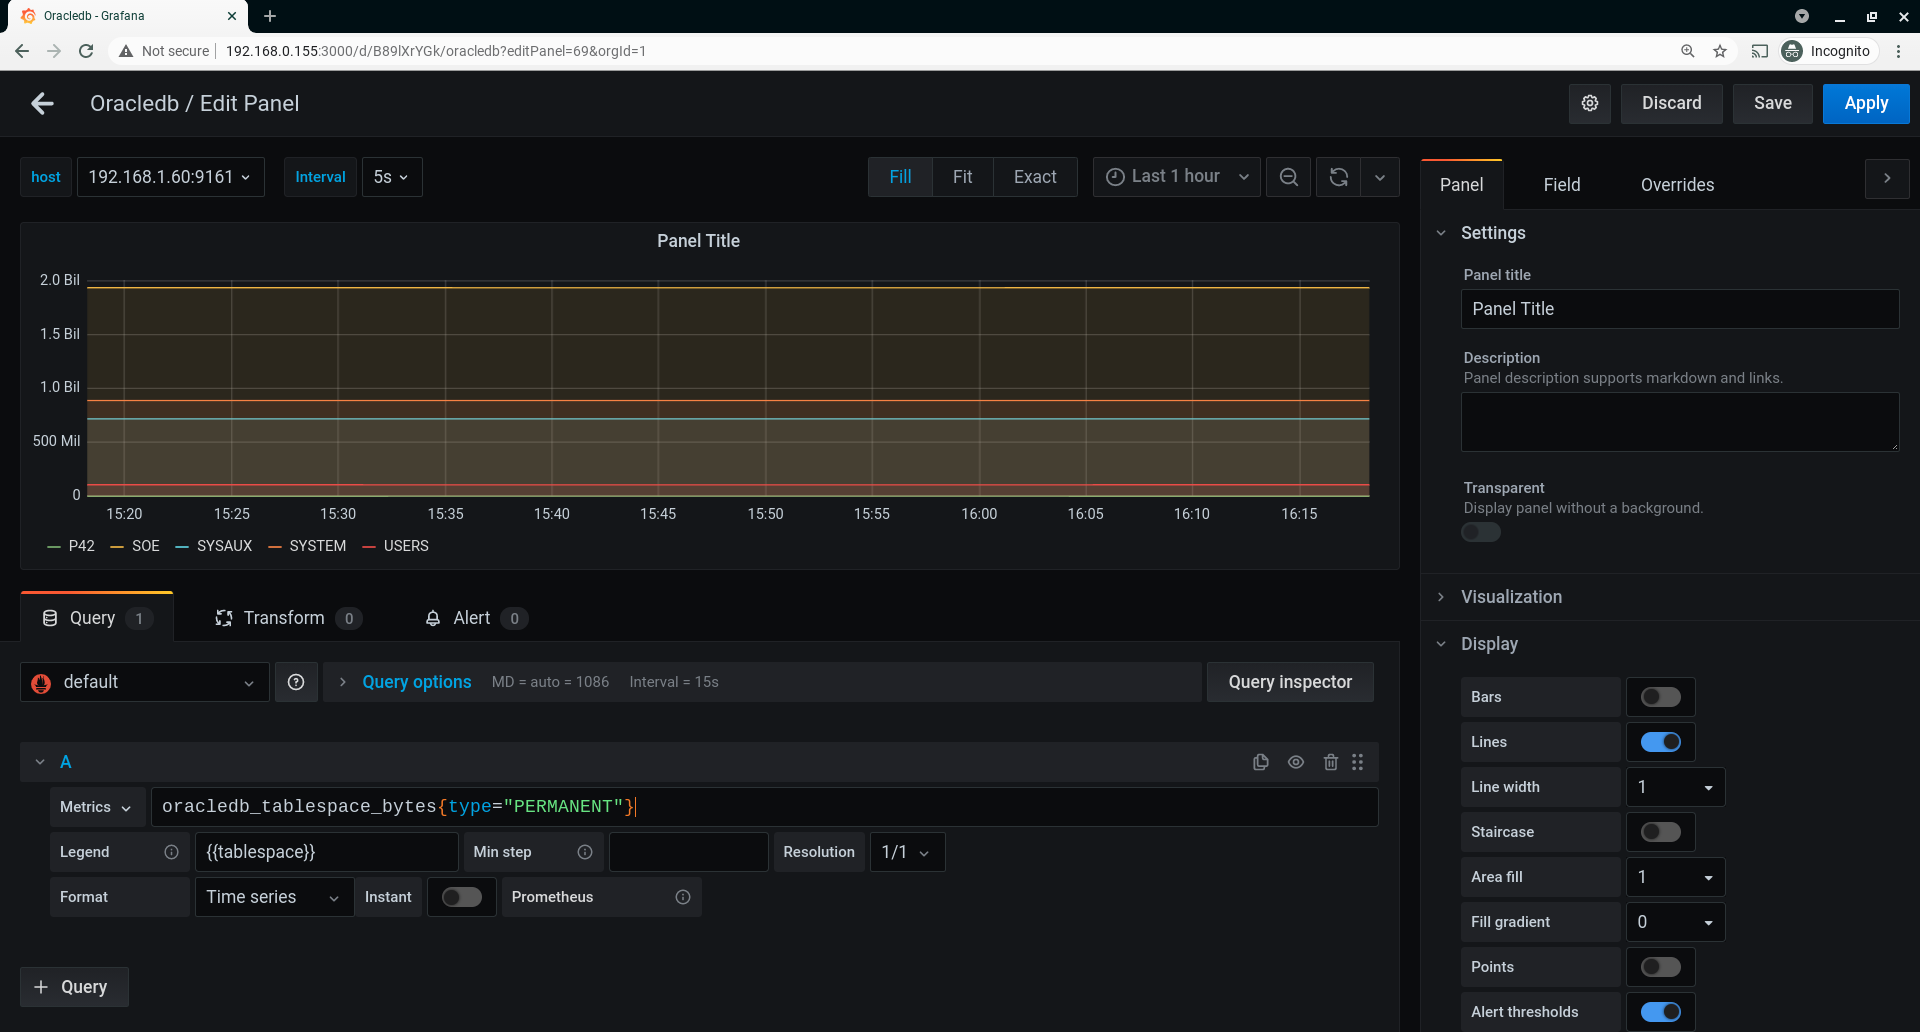
Now, let’s change the query so we only see the Tablespace which type is permanent and change the legend to Tablespace, so we will see the Tablespace name
The metric query will be "oracledb_tablespace_bytes{type="PERMANENT"}"
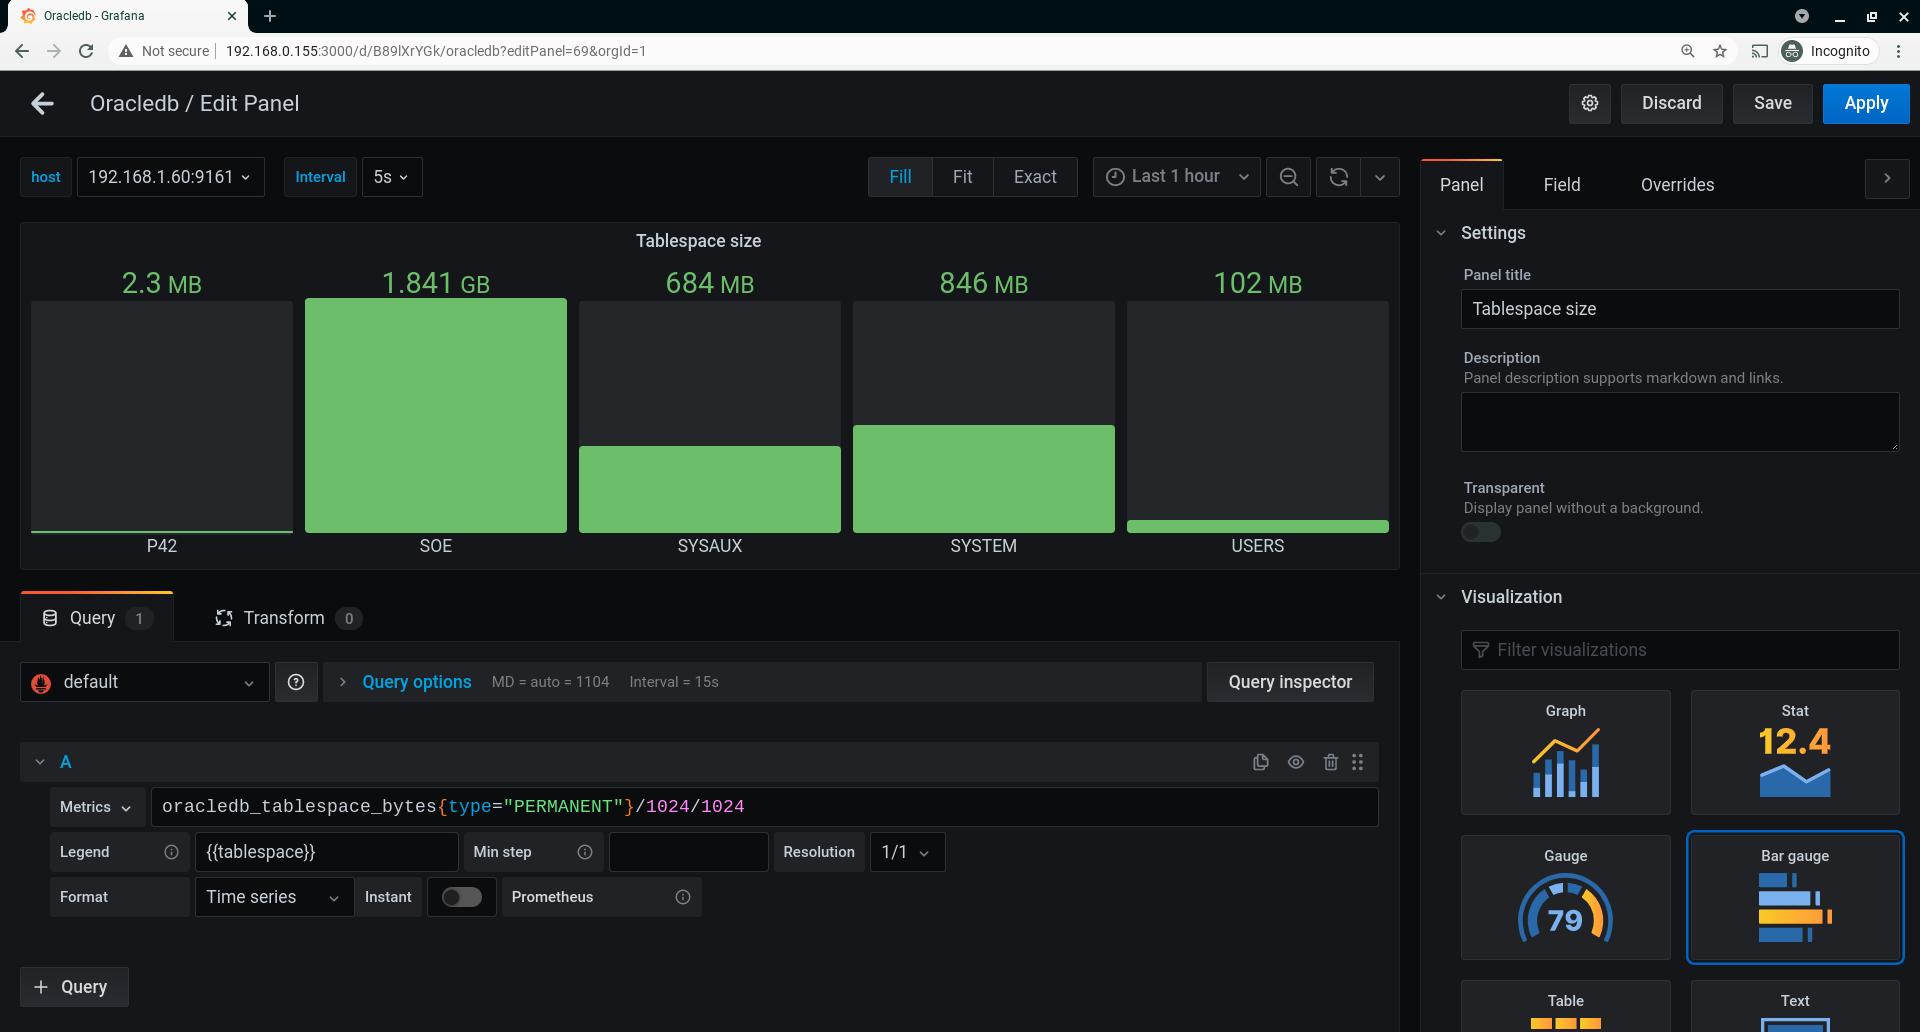
You can adjust the query and add calculations to adjust the output values and also change the different Panel visualizations settings
Custom oracledbexporter Metrics
The best way to check your oracledbexporter metrics, is to access directly to oracledbexporter ip:port in a browser so you can see all of them and the actual results you are getting

I have added an extra metrics file where I copied metrics found on this sysdig.com Article
|=| oem13 in ~/grafana_oracle ± |master ✓| → cat oracledbexporter/custom-metrics.toml

[[metric]]
context = "slow_queries"
metricsdesc = { p95_time_usecs= "Gauge metric with percentile 95 of elapsed time.", p99_time_usecs= "Gauge metric with percentile 99 of elapsed time." }
request = "select  percentile_disc(0.95)  within group (order by elapsed_time) as p95_time_usecs, percentile_disc(0.99)  within group (order by elapsed_time) as p99_time_usecs from v$sql where last_active_time >= sysdate - 5/(24*60)"
[[metric]]
context = "big_queries"
metricsdesc = { p95_rows= "Gauge metric with percentile 95 of returned rows.", p99_rows= "Gauge metric with percentile 99 of returned rows." }
request = "select  percentile_disc(0.95)  within group (order by rownum) as p95_rows, percentile_disc(0.99)  within group (order by rownum) as p99_rows from v$sql where last_active_time >= sysdate - 5/(24*60)"
[[metric]]

[....]
You can Disable/Enable it commenting the oracledbexporter/CUSTOM_METRICS option inside the docker-compose.yml file:
|=| oem13 in ~/grafana_oracle ± |master ✓| → cat docker-compose.yml

[....]

  oracledbexporter:
    image: iamseth/oracledb_exporter
    container_name: oracledbexporter
    volumes:
      - ./oracledbexporter:/etc/oracledb_exporter
    environment:
      - 'NLS_LANG=AMERICAN_AMERICA.WE8ISO8859P1'
      - 'DATA_SOURCE_NAME=${DB_CONNECTION_STRING}'
#      - 'DATA_SOURCE_NAME=${DB_CONNECTION_STRING:-dbsnmp/Welcome1@//rac1-scan:1521/db122}'
#      - 'DATA_SOURCE_NAME=dbsnmp/Welcome1@//rac2-scan:1521/st19'
      - 'CUSTOM_METRICS=/etc/oracledb_exporter/custom-metrics.toml'    <<<<<<<<<<<<<<<<<<
Troubleshooting
It took me some time to get everything working, so wanted to share some of the ways I found the different issues I had
You can test sqlplus connections using "docker sqlplus" if you are not sure how to setup oracledbexporter connection string
|=| oem13 in ~/grafana_oracle ± |master ✓| → docker run --net='host' --rm --interactive guywithnose/sqlplus sqlplus dbsnmp/Welcome1@//rac1-scan:1521/db122
Unable to find image 'guywithnose/sqlplus:latest' locally
Trying to pull repository docker.io/guywithnose/sqlplus ...
latest: Pulling from docker.io/guywithnose/sqlplus
Image docker.io/guywithnose/sqlplus:latest uses outdated schema1 manifest format. Please upgrade to a schema2 image for better future compatibility. More information at https://docs.docker.com/registry/spec/deprecated-schema-v1/
a3ed95caeb02: Pull complete
a5313052d57b: Downloading [=================================>                 ]     72MB/106.4MB
3f49d3a77d8b: Download complete                                                                                                                                        a531305a5313052d57b: Pull complete
3f49d3a77d8b: Pull complete
89a6b42a75e1: Pull complete
Digest: sha256:7a6b801971c182b2bda380184577e2776c973fc2c3199b46456cad1280f819fe
Status: Downloaded newer image for guywithnose/sqlplus:latest

SQL*Plus: Release 12.1.0.1.0 Production on Sat Feb 6 14:05:11 2021

Copyright (c) 1982, 2013, Oracle.  All rights reserved.

Last Successful login time: Sat Feb 06 2021 14:05:10 +00:00

Connected to:
Oracle Database 12c Enterprise Edition Release 12.2.0.1.0 - 64bit Production

SQL> SELECT NAME as DB_NAME, INSTANCE_NAME,CDB, status from GV$INSTANCE, V$DATABASE;

DB_NAME   INSTANCE_NAME    CDB STATUS
--------- ---------------- --- ------------
DB122   db1221     NO  OPEN

SQL>
You can enter in oracledbexporter docker to check/replace the default metrics
|=| oem13 in ~/grafana_oracle ± |master ✓| → docker exec -it oracledbexporter bash
root@7fcda18fca8d:/# cat default-metrics.toml
[[metric]]
context = "sessions"
labels = [ "status", "type" ]
metricsdesc = { value= "Gauge metric with count of sessions by status and type." }
request = "SELECT status, type, COUNT(*) as value FROM v$session GROUP BY status, type"

[[metric]]
context = "resource"
labels = [ "resource_name" ]
metricsdesc = { current_utilization= "Generic counter metric from v$resource_limit view in Oracle (current value).", limit_value="Generic counter metric from v$resource_limit view in Oracle (UNLIMITED: -1)." }
request="SELECT resource_name,current_utilization,CASE WHEN TRIM(limit_value) LIKE 'UNLIMITED' THEN '-1' ELSE TRIM(limit_value) END as limit_value FROM v$resource_limit"

[[metric]]
context = "asm_diskgroup"
labels = [ "name" ]
metricsdesc = { total = "Total size of ASM disk group.", free = "Free space available on ASM disk group." }
request = "SELECT name,total_mb*1024*1024 as total,free_mb*1024*1024 as free FROM v$asm_diskgroup_stat where exists (select 1 from v$datafile where name like '+%')"
ignorezeroresult = true

[[metric]]
context = "activity"
metricsdesc = { value="Generic counter metric from v$sysstat view in Oracle." }
fieldtoappend = "name"
request = "SELECT name, value FROM v$sysstat WHERE name IN ('parse count (total)', 'execute count', 'user commits', 'user rollbacks')"

[[metric]]
context = "process"
metricsdesc = { count="Gauge metric with count of processes." }
request = "SELECT COUNT(*) as count FROM v$process"

[[metric]]
context = "wait_time"
metricsdesc = { value="Generic counter metric from v$waitclassmetric view in Oracle." }
fieldtoappend= "wait_class"
request = '''
SELECT
  n.wait_class as WAIT_CLASS,
  round(m.time_waited/m.INTSIZE_CSEC,3) as VALUE
FROM
  v$waitclassmetric  m, v$system_wait_class n
WHERE
  m.wait_class_id=n.wait_class_id AND n.wait_class != 'Idle'
To make sure the oracleexporter is connecting to the system, start the docker like this (whithout detach)
This way you can see if you are trying to use wrong service name (or maybe is down) [ORA-12543] or password is incorrect [ORA-01017]:
|=| oem13 in ~/grafana_oracle/oracledbexporter ± |master ✓| → docker run --name oracledbexporter --network=host -p 9161 -e DATA_SOURCE_NAME=dbsnmp/Welcome1@//rac1-scan:1521b112 iamseth/oracledb_exporter
WARNING: Published ports are discarded when using host network mode
time="2021-02-06T14:20:53Z" level=info msg="Starting oracledb_exporter master" source="main.go:543"
time="2021-02-06T14:20:53Z" level=info msg="Successfully loaded default metrics from: default-metrics.toml" source="main.go:518"
time="2021-02-06T14:20:53Z" level=info msg="No custom metrics defined." source="main.go:533"
time="2021-02-06T14:21:05Z" level=error msg="Error pinging oracle: ORA-12543: TNS:destination host unreachable\n" source="main.go:215"
time="2021-02-06T14:21:05Z" level=info msg="Listening on :9161" source="main.go:579"
time="2021-02-06T14:21:22Z" level=error msg="Error pinging oracle: ORA-12543: TNS:destination host unreachable\n" source="main.go:215"
time="2021-02-06T14:21:25Z" level=error msg="Error pinging oracle: ORA-12543: TNS:destination host unreachable\n" source="main.go:215"
^C
|=| oem13 in ~/grafana_oracle/oracledbexporter ± |master ✓| →

|=| oem13 in ~/grafana_oracle/oracledbexporter ± |master ✓| → docker run --name oracledbexporter --network=host -p 9161 -e DATA_SOURCE_NAME=dbsnmp/pass@//rac1-scan:1521/db1 iamseth/oracledb_exporter
WARNING: Published ports are discarded when using host network mode
time="2021-02-06T14:19:42Z" level=info msg="Starting oracledb_exporter master" source="main.go:543"
time="2021-02-06T14:19:42Z" level=info msg="Successfully loaded default metrics from: default-metrics.toml" source="main.go:518"
time="2021-02-06T14:19:42Z" level=info msg="No custom metrics defined." source="main.go:533"
time="2021-02-06T14:19:45Z" level=error msg="Error pinging oracle: ORA-01017: invalid username/password; logon denied\n" source="main.go:215"
time="2021-02-06T14:19:45Z" level=info msg="Listening on :9161" source="main.go:579"
time="2021-02-06T14:19:53Z" level=error msg="Error pinging oracle: ORA-01017: invalid username/password; logon denied\n" source="main.go:215"
^C
|=| oem13 in ~/grafana_oracle/oracledbexporter ± |master ✓| →
This is the output of the oracle-exporter working
|=| oem13 in ~/grafana_oracle/oracledbexporter ± |master ✓| → docker run --name oracledbexporter --network=host -p 9161 -e DATA_SOURCE_NAME=dbsnmp/Welcome1@//rac1-scan:1521b122 iamseth/oracledb_exporter
WARNING: Published ports are discarded when using host network mode
time="2021-02-06T14:16:04Z" level=info msg="Starting oracledb_exporter master" source="main.go:543"
time="2021-02-06T14:16:04Z" level=info msg="Successfully loaded default metrics from: default-metrics.toml" source="main.go:518"
time="2021-02-06T14:16:04Z" level=info msg="No custom metrics defined." source="main.go:533"
time="2021-02-06T14:16:04Z" level=info msg="Listening on :9161" source="main.go:579"
[....]
If you are running docker-compose with detach option, you can still access all the container logs executing the following:
|=| oem13 in ~/grafana_oracle ± |master ✓| → docker-compose up -d
Building with native build. Learn about native build in Compose here: https://docs.docker.com/go/compose-native-build/
Starting prometheus       ... done
Starting nodeexporter     ... done
Starting oracledbexporter ... done
Starting cadvisor         ... done
Starting pushgateway      ... done
Starting alertmanager     ... done
Starting caddy            ... done
Starting grafana          ... done

|=| oem13 in ~/grafana_oracle ± |master ✓| →

|=| oem13 in ~/grafana_oracle ± |master ✓| → docker-compose logs -f --tail 100
caddy               | Activating privacy features... done.
oracledbexporter    | time="2021-02-06T14:32:01Z" level=info msg="Starting oracledb_exporter master" source="main.go:543"
nodeexporter        | level=info ts=2021-02-06T14:32:03.142Z caller=node_exporter.go:177 msg="Starting node_exporter" version="(version=1.0.1, branch=HEAD, revision=3715be6ae899f2a9b9dbfd9c39f3e09a7bd4559f)"
nodeexporter        | level=info ts=2021-02-06T14:32:03.142Z caller=node_exporter.go:178 msg="Build context" build_context="(go=go1.14.4, user=root@1f76dbbcfa55, date=20200616-12:44:12)"
[....]
Comments
very thorough . thanks for sharing . keep it up
Thank you! ☺️
Went through many of Your blog posts and all are very informative and professional, thank You! Regards. G
Oh, thank you! Really appreciate it ☺️