One of the best things about the Oracle Community is the amount of people willing to share cool information and tools they develop on their own.
I guess we could say "Sharing is caring" 🙂
One of the people you should start following (but I’m sure you already do..) is Kamil Stawiarski.
He recently created and shared an amazing tool to do Trace Parsing and find interesting performance stats from them, specially when you need to work with massive amount of traces.
The tool is called Parse Trace OWI and you can find how it works in his recent post WHAT TO DO WITH 5GB OF TRACE FILES?
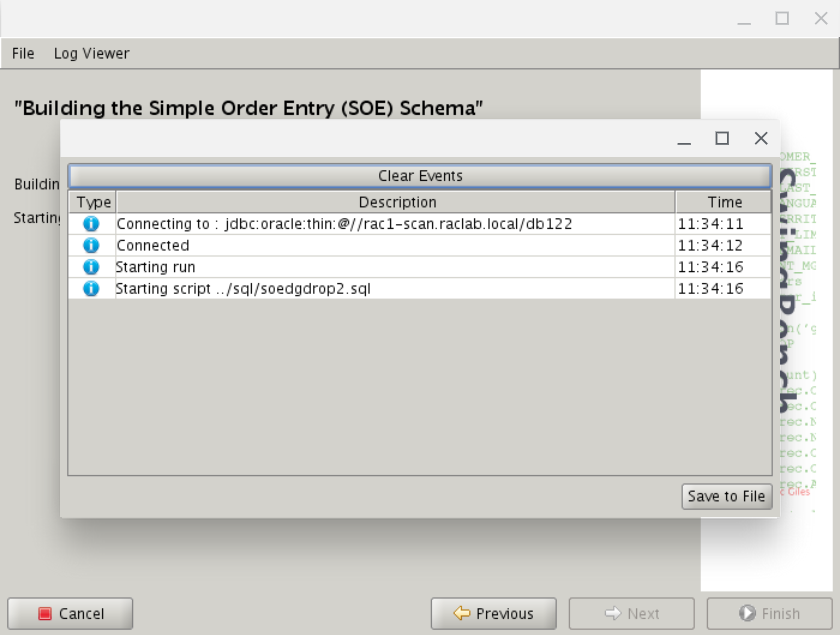
I dont currently have that amount of traces, but I thought could just spin up one small DB 12.2 and enable tracing during Swingbench Schema/Data creation.
First, lets start Installing Parse Trace OWI in our DB server.
I have to install Go and git first, of course.
For GO, just followed this guide (but changing to most recent version)
[root@rac1-node1 ~]# yum install git -y
Loaded plugins: langpacks, ulninfo
ol7_UEKR5                                                                                                                  | 2.5 kB  00:00:00
ol7_latest                                                                                                                 | 2.7 kB  00:00:00
(1/5): ol7_UEKR5/x86_64/updateinfo                                                                                         |  50 kB  00:00:00

[....]

Installed:
  git.x86_64 0:1.8.3.1-23.el7_8

Dependency Installed:
  perl-Error.noarch 1:0.17020-2.el7                                       perl-Git.noarch 0:1.8.3.1-23.el7_8

Complete!
[root@rac1-node1 ~]#

[root@rac1-node1 ~]# wget https://golang.org/dl/go1.15.6.linux-amd64.tar.gz
--2021-01-09 11:09:20--  https://golang.org/dl/go1.15.6.linux-amd64.tar.gz
Resolving golang.org (golang.org)... 172.217.169.81, 2a00:1450:4009:819::2011
Connecting to golang.org (golang.org)|172.217.169.81|:443... connected.
HTTP request sent, awaiting response... 302 Found
Location: https://dl.google.com/go/go1.15.6.linux-amd64.tar.gz [following]
--2021-01-09 11:09:21--  https://dl.google.com/go/go1.15.6.linux-amd64.tar.gz
Resolving dl.google.com (dl.google.com)... 216.58.204.78, 2a00:1450:4009:814::200e
Connecting to dl.google.com (dl.google.com)|216.58.204.78|:443... connected.
HTTP request sent, awaiting response... 200 OK
Length: 120951514 (115M) [application/octet-stream]
Saving to: ‘go1.15.6.linux-amd64.tar.gz.1’

100%[========================================================================================================>] 120,951,514 7.21MB/s   in 17s

2021-01-09 11:09:38 (6.92 MB/s) - ‘go1.15.6.linux-amd64.tar.gz.1’ saved [120951514/120951514]

[root@rac1-node1 ~]# sudo tar -C /usr/local -xzf go1.15.6.linux-amd64.tar.gz
[root@rac1-node1 ~]# su - oracle
[oracle@rac1-node1 ~]$ vi .bash_profile
[oracle@rac1-node1 ~]$ grep -i path .bash_profile
PATH=$PATH:$HOME/.local/bin:$HOME/bin:/usr/local/go/bin
PATH=/home/oracle/scripts/:$PATH
export PATH
[oracle@rac1-node1 ~]$
[oracle@rac1-node1 ~]$ source .bash_profile
[oracle@rac1-node1 ~]$
Clone tracefile_parsers and build Parse Trace OWI
[oracle@rac1-node1 ~]$ git clone https://github.com/ora600pl/tracefile_parsers
Cloning into 'tracefile_parsers'...
remote: Enumerating objects: 65, done.
remote: Counting objects: 100% (65/65), done.
remote: Compressing objects: 100% (47/47), done.
remote: Total 80 (delta 31), reused 50 (delta 17), pack-reused 15
Unpacking objects: 100% (80/80), done.
[oracle@rac1-node1 ~]$
[oracle@rac1-node1 ~]$ export GOPATH=$PWD/tracefile_parsers/parse_trace_owi
[oracle@rac1-node1 ~]$ export PATH=$GOPATH:$PATH
[oracle@rac1-node1 ~]$ go build $GOPATH/parse_trace_owi.go
[oracle@rac1-node1 ~]$ ./parse_trace_owi
  -cpuprofile string
        write cpu profile to file
  -d string
        debug (default "false")
  -event string
        Display SQLids for specified event
  -p int
        parallel degree (default 1)
  -s string
        where to search for trace files
  -sqlid string
        Display wait events for sqlid
  -tf string
        time from (default "2020-01-01 00:00:00.100")
  -top int
        Only TOP n elements
  -tt string
        time to (default "2020-01-02 00:00:00.100")
[oracle@rac1-node1 ~]$
I enabled Tracing at DB level, so we make sure we get some nice traces during the Swingbench Schema/Data creation.
db1221 - SQL>ALTER SYSTEM SET EVENTS '10046 trace name context forever, level 12';

System altered.

db1221 - SQL>
And now, to generate some activity

Let’s analyse the traces (for the time it took, to analyse everythong :stuck_out_tongue_winking_eye:, you can see I have less DB activity than Kamil shows in his post)
TOP 10 of wait events:
[oracle@rac1-node1 ~]$ ./parse_trace_owi -s /u01/app/oracle/diag/rdbms/db122/db1221/trace/ -p 4 -tf="2021-01-09 11:35:00.000" -tt="2021-01-09 12:00:00.000" -top=10
                                                  WAIT EVENT            ELA(ms)                 COUNT           AVG(ms)                 STDDEV(ms)              CLASS

                                   'flashback log file sync'            1931.695000             315             6.132365                10.302641               User I/O
                                     'gc current block busy'            3424.641000             393             8.714099                20.340445               Cluster
                                     'enq: IV -  contention'            3988.528000             1224            3.258601                3.142054                UNKNOWN
                                           'buffer busy waits'            4084.563000             963             4.241498                24.400184               Concurrency
                            'flashback buf free by RVWR'            4273.345000             74              57.747905               48.967046               Configuration
                                                    'log file sync'            4287.429000             445             9.634672                8.247748                Commit
                                    'gc buffer busy acquire'            5154.863000             876             5.884547                16.949100               Cluster
                                    'gc buffer busy release'            5338.218000             244             21.877943               33.154836               Cluster
                                   'db file sequential read'            13500.061000            4117            3.279102                5.146506                User I/O
                                   'cursor: pin S wait on X'            21360.750000            404             52.873144               26.144244               Concurrency
Everythong took: 6.117350 ms
[oracle@rac1-node1 ~]$
TOP 10 SQL IDs waiting for ‘cursor: pin S wait on X’:
[oracle@rac1-node1 ~]$ ./parse_trace_owi -s /u01/app/oracle/diag/rdbms/db122/db1221/trace/ -p 4 -tf="2021-01-09 11:35:00.000" -tt="2021-01-09 12:00:00.000" -top=10 -event="'cursor: pin S wait on X'"
SQLs for event 'cursor: pin S wait on X'
'ftwavddscfwvh'         879.913000
'1d5382uc80v5s'         880.938000
'fyfbf4hhzj9k1'         886.067000
'128d10u73m6gs'         932.065000
'783fyg6rpujtf'         1000.191000
'g2xjf3yf4u9ux'         1017.430000
'81ajfu4j9cscv'         1120.566000
'dcspxv91pk3u7'         1241.761000
'3dgxux71h1rz5'         1258.127000
'889hf7ysfx1xn'         2152.660000
It was 24.590164 percent out of all SQLs - 30 out of 122
Everythong took: 4.941850 ms
[oracle@rac1-node1 ~]$
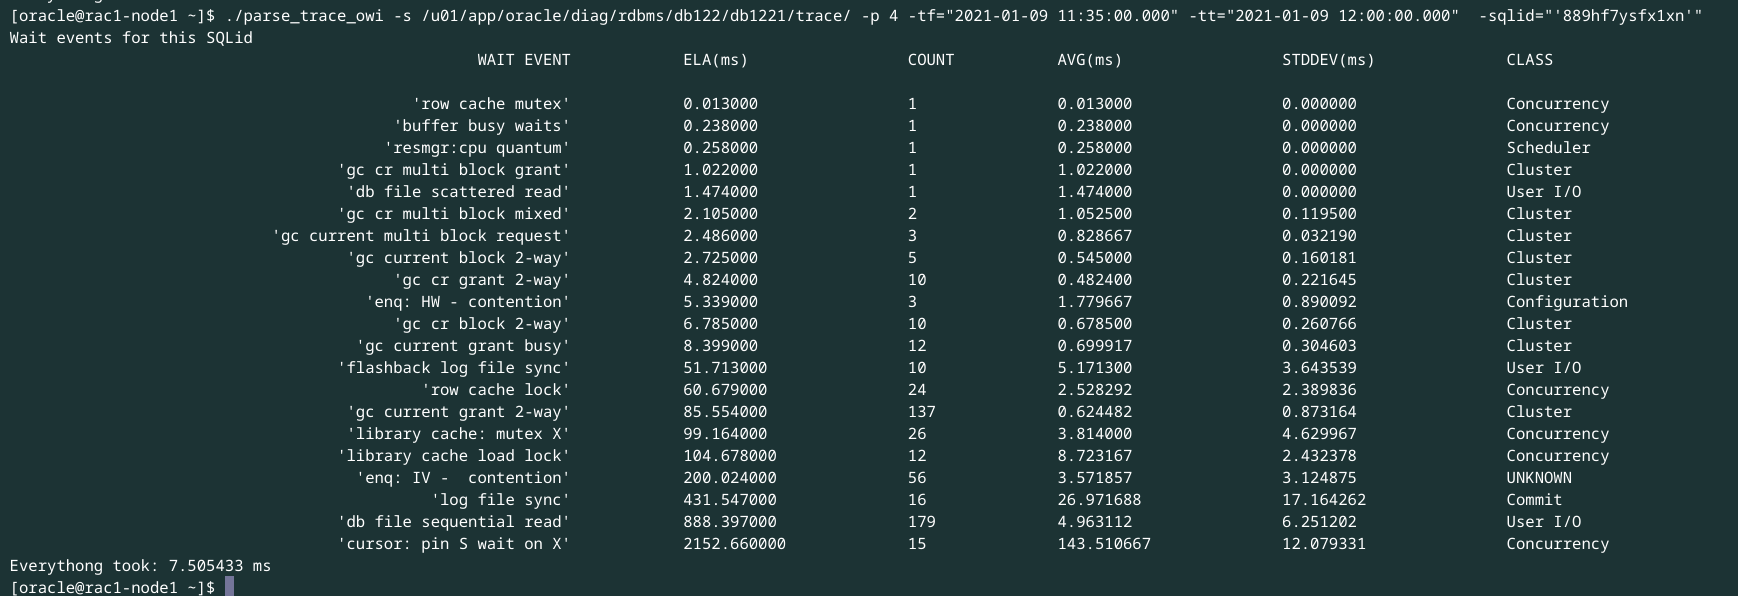
Checking 889hf7ysfx1xn Wait Events:
[oracle@rac1-node1 ~]$ ./parse_trace_owi -s /u01/app/oracle/diag/rdbms/db122/db1221/trace/ -p 4 -tf="2021-01-09 11:35:00.000" -tt="2021-01-09 12:00:00.000"  -sqlid="'889hf7ysfx1xn'"
Wait events for this SQLid
                                                  WAIT EVENT            ELA(ms)                 COUNT           AVG(ms)                 STDDEV(ms)CLASS

                                           'row cache mutex'            0.013000                1               0.013000                0.000000 Concurrency
                                         'buffer busy waits'            0.238000                1               0.238000                0.000000 Concurrency
                                        'resmgr:cpu quantum'            0.258000                1               0.258000                0.000000 Scheduler
                                   'gc cr multi block grant'            1.022000                1               1.022000                0.000000 Cluster
                                    'db file scattered read'            1.474000                1               1.474000                0.000000 User I/O
                                   'gc cr multi block mixed'            2.105000                2               1.052500                0.119500 Cluster
                            'gc current multi block request'            2.486000                3               0.828667                0.032190 Cluster
                                    'gc current block 2-way'            2.725000                5               0.545000                0.160181 Cluster
                                         'gc cr grant 2-way'            4.824000                10              0.482400                0.221645 Cluster
                                      'enq: HW - contention'            5.339000                3               1.779667                0.890092 Configuration
                                         'gc cr block 2-way'            6.785000                10              0.678500                0.260766 Cluster
                                     'gc current grant busy'            8.399000                12              0.699917                0.304603 Cluster
                                   'flashback log file sync'            51.713000               10              5.171300                3.643539 User I/O
                                            'row cache lock'            60.679000               24              2.528292                2.389836 Concurrency
                                    'gc current grant 2-way'            85.554000               137             0.624482                0.873164 Cluster
                                    'library cache: mutex X'            99.164000               26              3.814000                4.629967 Concurrency
                                   'library cache load lock'            104.678000              12              8.723167                2.432378 Concurrency
                                     'enq: IV -  contention'            200.024000              56              3.571857                3.124875 UNKNOWN
                                             'log file sync'            431.547000              16              26.971688               17.164262Commit
                                   'db file sequential read'            888.397000              179             4.963112                6.251202 User I/O
                                   'cursor: pin S wait on X'            2152.660000             15              143.510667              12.079331Concurrency
Everythong took: 6.146940 ms
[oracle@rac1-node1 ~]$
What an amazing tool, no need for Diagnostic Pack to get some really cool stats.
I’m sure this will be only improve, so make sure you subscribe to Parse Trace OWI and Kamil’s blog

Comments