
I used Grafana some time ago, but moved away from it, since I started other projects.
Not sure exactly why, but since I rebuild my NAS and moved from FreeNAS to Openmedaivault I decided to check Grafana again and have it installed as docker containers in the new system (openmediavault is a debian based system, which allows some extra goodies like NFS and docker when you add OVM Extras)
Anyway, this is not really relevant, since the following document should work for any x86 system with Docker and Docker Compose installed (there are other guides you can find to get the ARM version for the docker builds if you want to try in Raspberry Pi)
Lets start creating the project and volumes directories
root@vault:/etc/docker# cd /vol01/
root@vault:/vol01# mkdir -p Docker/monitoring
root@vault:/vol01# cd Docker/monitoring
Create a Docker Compose playbook, which will contain all the necessary info for the different builds.
Reading the playbook you can see what we are doing.
We build Grafana and make sure the port 3000 where normally listen, is redirected to the port 3000 of the host. Same for the InfluxDB and its port 8086
We also create a bridge network called monitoring to make sure the Containers have access to the host and internet
For Telegraf configuration we need to make sure the default configuration file is "redirected" to the file created in the host, so we don’t need to enter the container to modify anything, will be done directly in the host
The 2 Persistent Volume will allow to get the data into the host so it makes the installation more permanent.
Of course, remember to chose better USER/PASSWORDS if you are doing this. I just wanted to give it a try 🙂
root@vault:/vol01/Docker/monitoring# cat docker-compose.yml
version: "2"
services:
  grafana:
    image: grafana/grafana
    container_name: grafana
    restart: always
    ports:
      - 3000:3000
    networks:
      - monitoring
    volumes:
      - grafana-volume:/vol01/Docker/monitoring
  influxdb:
    image: influxdb
    container_name: influxdb
    restart: always
    ports:
      - 8086:8086
    networks:
      - monitoring
    volumes:
      - influxdb-volume:/vol01/Docker/monitoring
    environment:
      - INFLUXDB_DB=telegraf
      - INFLUXDB_USER=telegraf
      - INFLUXDB_ADMIN_ENABLED=true

      - INFLUXDB_ADMIN_USER=admin
      - INFLUXDB_ADMIN_PASSWORD=Welcome1
  telegraf:
    image: telegraf
    container_name: telegraf
    restart: always
    extra_hosts:
     - "influxdb:192.168.0.110"
    environment:
      HOST_PROC: /rootfs/proc
      HOST_SYS: /rootfs/sys
      HOST_ETC: /rootfs/etc
    volumes:
     - ./telegraf.conf:/etc/telegraf/telegraf.conf:ro
     - /var/run/docker.sock:/var/run/docker.sock:ro
     - /sys:/rootfs/sys:ro
     - /proc:/rootfs/proc:ro
     - /etc:/rootfs/etc:ro
networks:
  monitoring:
volumes:
  grafana-volume:
    external: true
  influxdb-volume:
    external: true
root@vault:/vol01/Docker/monitoring#
Create telegraf.conf file and add the following default configuration.
For mi case, the host IP is 192.168.0.110 and I also added some ping input just to try to see some of my local devices
root@vault:/vol01/Docker/monitoring# cat telegraf.conf
[global_tags]

[agent]
  interval = "60s"
  round_interval = true
  metric_batch_size = 1000
  metric_buffer_limit = 10000
  collection_jitter = "0s"
  flush_interval = "10s"
  flush_jitter = "0s"
  precision = ""
  hostname = "192.168.0.110"
  omit_hostname = false

[[outputs.influxdb]]
urls = ["http://192.168.0.110:8086"]
database = "telegraf"
timeout = "5s"
username = "telegraf"
password = "Welcome1"

[[inputs.ping]]
interval = "5s"
urls = ["192.168.0.44", "192.168.0.131", "192.168.0.130", "google.com", "amazon.com", "github.com"]
count = 4
ping_interval = 1.0
timeout = 2.0

[[inputs.cpu]]
  percpu = true
  totalcpu = true
  collect_cpu_time = false
  report_active = false

[[inputs.disk]]
  ignore_fs = ["tmpfs", "devtmpfs", "devfs", "iso9660", "overlay", "aufs", "squashfs"]

[[inputs.diskio]]

[[inputs.kernel]]

[[inputs.mem]]

[[inputs.processes]]

[[inputs.swap]]

[[inputs.system]]

root@vault:/vol01/Docker/monitoring#
Start everything in the docker-compose playbook. It will take some time since needs to download all the images if you don’t have it, but should be less than 5 minutes if your system is fast enough
root@vault:/vol01/Docker/monitoring# docker-compose up -d
Creating network "monitoring_monitoring" with the default driver
Pulling grafana (grafana/grafana:)...
latest: Pulling from grafana/grafana
4167d3e14976: Pull complete
dd2bf2ad25d9: Pull complete
bc3026833a3a: Pull complete
8789bc1f4250: Pull complete
fc931efc1e71: Pull complete
09de0f0f5c91: Pull complete
b9833e14e8a2: Pull complete
763366917f49: Pull complete
Digest: sha256:b409a69218ca5990b61e33fe00121c94b2f9b5a7ec2f3118c703454c26067020
Status: Downloaded newer image for grafana/grafana:latest
Creating grafana ... done
Creating influxdb ... done
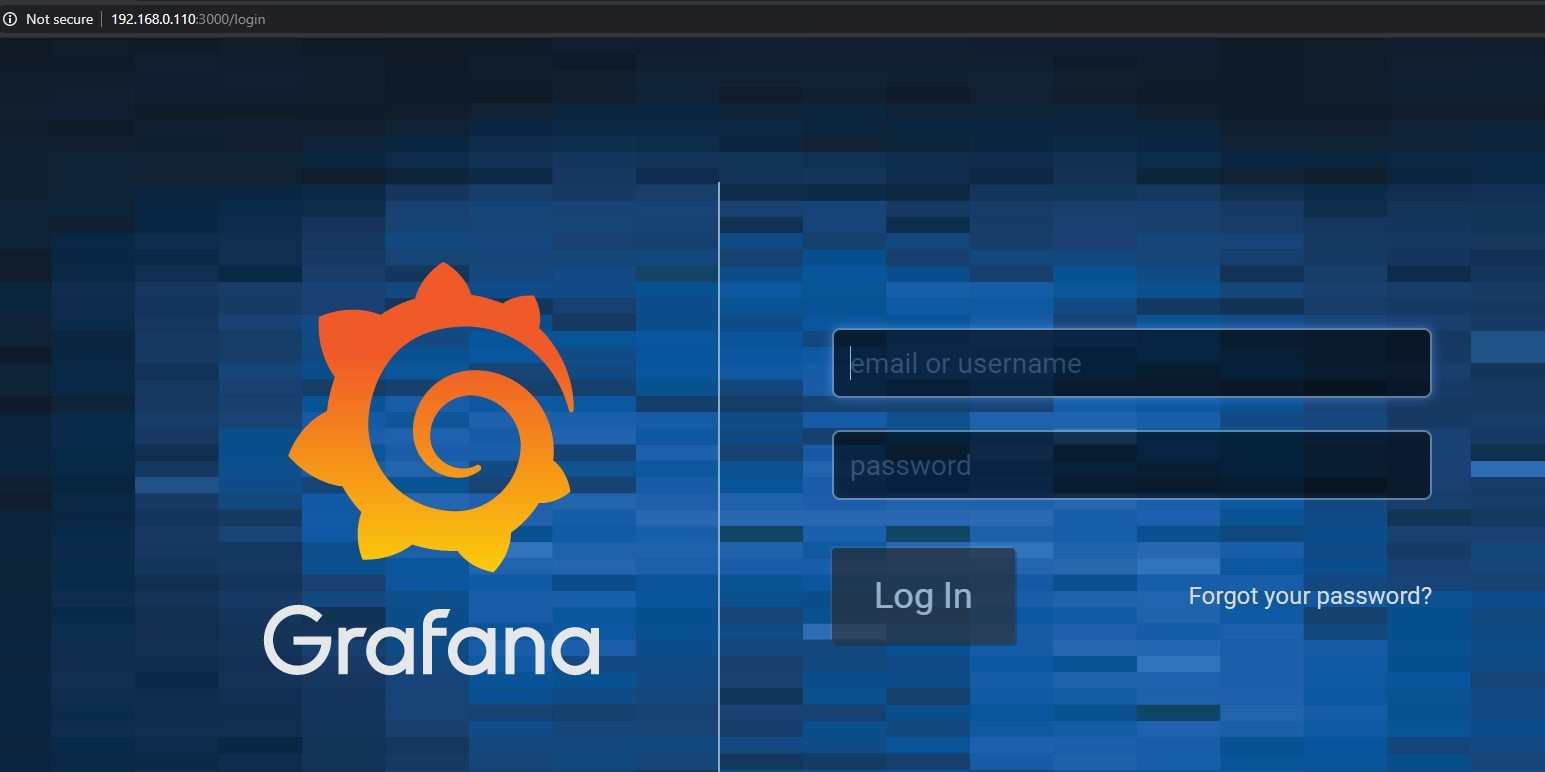
root@vault:/vol01/Docker/monitoring#and Voila! we just got Grafana running. Enter the host IP and port 3000 and you are ready to start
To enter Grafana, the default user and password is "admin", but will request you to create new password in the first login process.
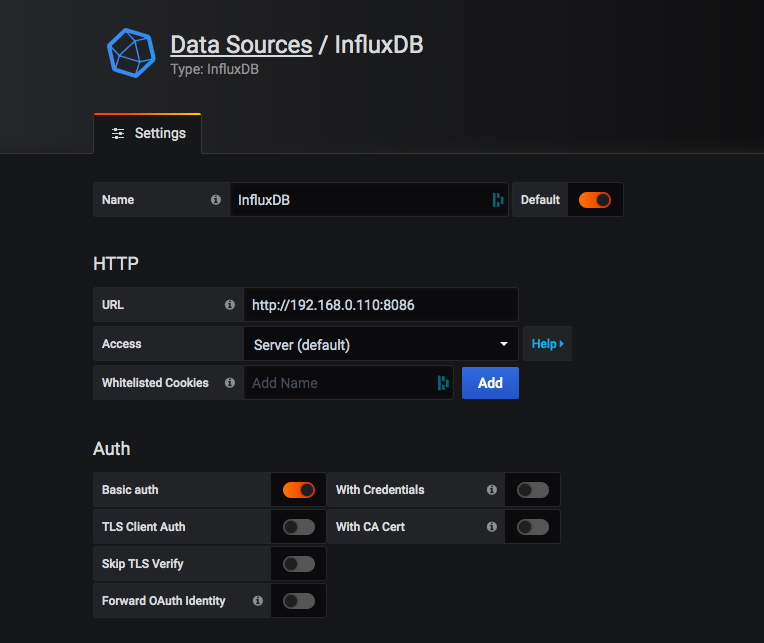
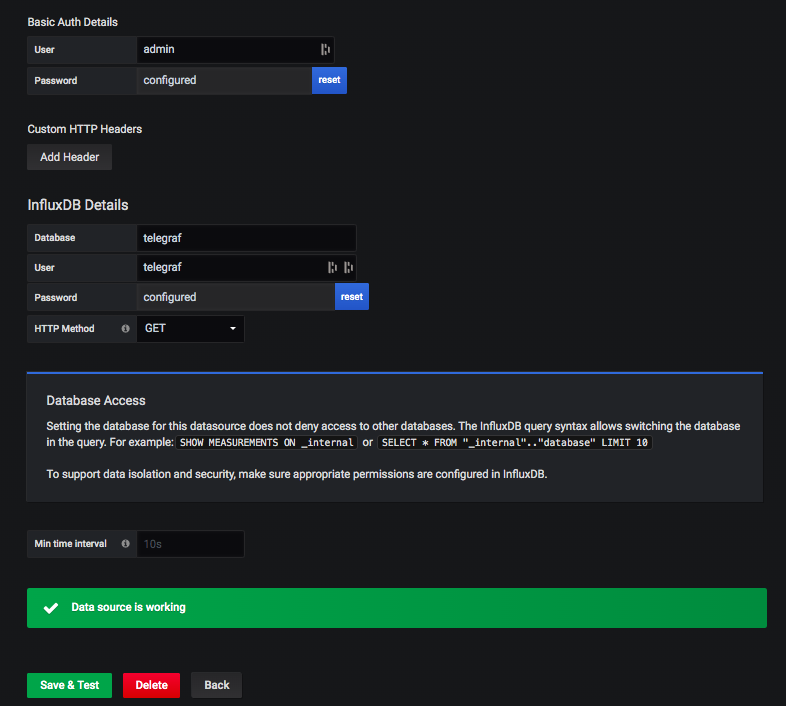
You just need to set InfluxDB as the default Datasource using the details we set in our Docker Compose:
I recommend you to have a look to different Dashboards you can import just adding the ID into the import dialog, very handy
Some additional notes I would like to add.
You can always enter the containers from the host and add for example plugins for Grafana.
In this example, I’m using grafana-cli to install raintank-worldping-app plugin and doing a container restart
root@vault:/vol01/Docker/monitoring/telegraf# docker exec -i grafana sh -c 'grafana-cli plugins install raintank-worldping-app'
installing raintank-worldping-app @ 1.2.7
from: https://grafana.com/api/plugins/raintank-worldping-app/versions/1.2.7/download
into: /var/lib/grafana/plugins

¿ Installed raintank-worldping-app successfully

Restart grafana after installing plugins . <service grafana-server restart>

root@vault:/vol01/Docker/monitoring/telegraf#

root@vault:/vol01/Docker/monitoring/telegraf# docker restart grafana
grafana
Something else you can easily do, is to ad more tools to telegraf, so you make sure you can user more input, like ipmitool
root@vault:/vol01/Docker/monitoring# docker exec -i telegraf sh -c 'apt-get update && apt-get install ipmitool -y'If you want to check information directly from the InfluxDB, you can enter the influxdb container and access the telegraf DB we created for this example:
root@vault:/vol01/Docker/monitoring# docker exec -it influxdb sh
# influx
Connected to http://localhost:8086 version 1.8.0
InfluxDB shell version: 1.8.0

> use telegraf
Using database telegraf

> show measurements
name: measurements
name
----
cpu
disk
diskio
ipmi_sensor
kernel
mem
ping
processes
swap
system
>

> select * from snmp limit 5
name: snmp
time                agent_host    host          hostname ifConnectorPresent ifCounterDiscontinuityTime ifHCInBroadcastPkts ifHCInMulticastPkts ifHCInOctets ifHCInUcastPkts ifHCOutBroadcastPkts ifHCOutMulticastPkts ifHCOutOctets ifHCOutUcastPkts ifHighSpeed ifInBroadcastPkts ifInMulticastPkts ifName ifOutBroadcastPkts ifOutMulticastPkts ifPromiscuousMode
----                ----------    ----          -------- ------------------ -------------------------- ------------------- ------------------- ------------ --------------- -------------------- -------------------- ------------- ---------------- ----------- ----------------- ----------------- ------ ------------------ ------------------ -----------------
1589035381000000000 192.168.0.130 192.168.0.110 raspi    1                  0                          0                   0                   389903772615 462952905       0                    0                    368758163852  375893063        100         0                 0                 eth0   0                  0                  2
1589035381000000000 192.168.0.130 192.168.0.110 raspi    2                  0                          0                   0                   52457171     271373          0                    0                    52457171      271373           10          0                 0                 lo     0                  0                  2
1589035381000000000 192.168.0.130 192.168.0.110 raspi    1                  0                          0                   0                   0            0               0                    0                    0             0                0           0                 0                 wlan0  0                  0                  2
1589035381000000000 192.168.0.130 192.168.0.110 raspi    1                  0                          0                   0                   5199967172   4139726         0                    0                    134835203     1845713          0           0                 0                 tun0   0                  0                  2
1589035440000000000 192.168.0.130 192.168.0.110 raspi    1                  0                          0                   0                   389903837726 462953205       0                    0                    368758211825  375893248        100         0                 0                 eth0   0                  0                  2
>
Hope this makes you to start your Grafana project. Is a very versatile tool and with Docker, you can just have it installed and tested anywhere you like
Comments